OPEN-SOURCE SCRIPT
已更新 Market Pulse Pro

Market Pulse Pro (Pulse‑X) — User Guide
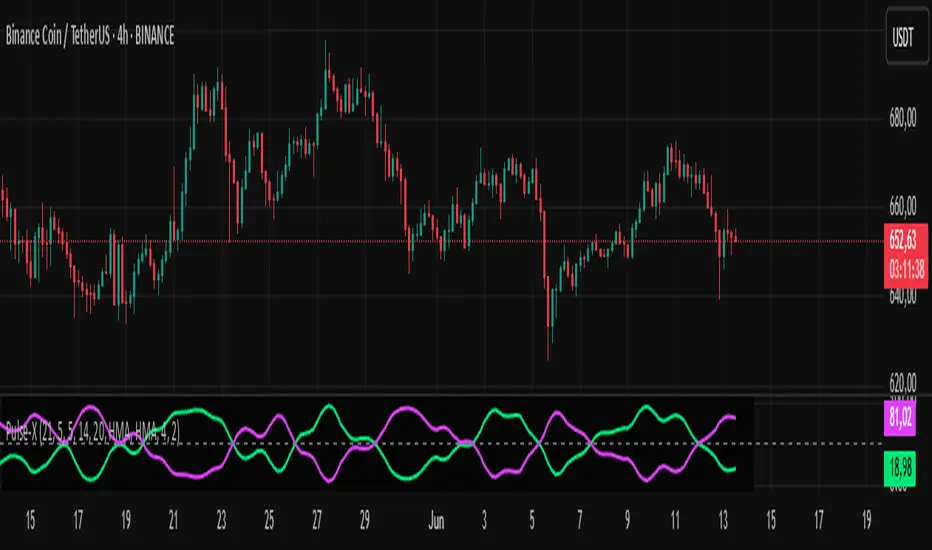
Market Pulse Pro, also known as Pulse‑X, is an advanced momentum indicator that combines SMI, Stochastic RSI, and a smoothed signal line to identify zones of buying and selling strength in the market. It is designed to assess the balance of power between bulls and bears with clear visualizations.
How It Works
The indicator calculates three main components:
SMI (Stochastic Momentum Index) – measures price position relative to its recent range.
Stochastic RSI – captures overbought/oversold extremes of the RSI.
Smoothed Signal Line – based on closing price, smoothed using various methods (such as HMA, EMA, etc.).
Each component is normalized to create two final values:
Bull Herd (Buying Strength) – green line.
Bear Winter (Selling Strength) – red line.
Interpretation
Bull Herd (high green values): Bulls dominate the market. May indicate the start or continuation of an uptrend.
Bear Winter (high red values): Bears dominate. May indicate reversal or continuation of a downtrend.
Convergence around 50%: Market is balanced. Signals are weaker or indecisive.
Tip: Combine with price action analysis or support/resistance levels to confirm entries.
Customizable Settings
You can adjust:
SMI Period, Smooth K, and D – control the sensitivity of the SMI.
RSI Period – sets the RSI calculation window.
Signal Period – period for the price-based signal line.
Smoothing Methods – choose between HMA, EMA, WMA, JMA, SMMA, etc.
Line Width – thickness of the plotted lines.
Note: The JMA (Jurik Moving Average) used in this script is not the original proprietary version.
It is a custom public version, based on open-source code shared by the TradingView community.
The original JMA is copyrighted and owned by Jurik Research.
How to Use It in Practice
Buy Entries
When the green Bull Herd line crosses above 60 and the red Bear Winter line falls below 40.
Entry is more reliable if the green line is rising steadily.
Sell Entries
When the red Bear Winter line crosses above 60 and the green Bull Herd line falls.
Signals are stronger when there is a clear crossover and divergence between the two lines.
Avoid trading near the neutral zone (~50%), where the market shows indecision.
Additional Tips
Combine with volume analysis or reversal candlestick patterns for higher accuracy.
Test different smoothing methods: HMA is more responsive, SMMA is smoother and slower.
版本注释
.版本注释
"Note: this script has been updated and renamed to Market Pulse-X to better reflect its functionality and avoid confusion."版本注释
"Background color updated to black by default, with an option for the user to select their preferred background color. Also added background offset control to improve indicator visualization."版本注释
"Update the RGB colors of the green and red lines to make the indicator more vibrant."版本注释
Update color thanks开源脚本
秉承TradingView的精神,该脚本的作者将其开源,以便交易者可以查看和验证其功能。向作者致敬!您可以免费使用该脚本,但请记住,重新发布代码须遵守我们的网站规则。
免责声明
这些信息和出版物并非旨在提供,也不构成TradingView提供或认可的任何形式的财务、投资、交易或其他类型的建议或推荐。请阅读使用条款了解更多信息。
开源脚本
秉承TradingView的精神,该脚本的作者将其开源,以便交易者可以查看和验证其功能。向作者致敬!您可以免费使用该脚本,但请记住,重新发布代码须遵守我们的网站规则。
免责声明
这些信息和出版物并非旨在提供,也不构成TradingView提供或认可的任何形式的财务、投资、交易或其他类型的建议或推荐。请阅读使用条款了解更多信息。