OPEN-SOURCE SCRIPT
Volume Stack Emojis

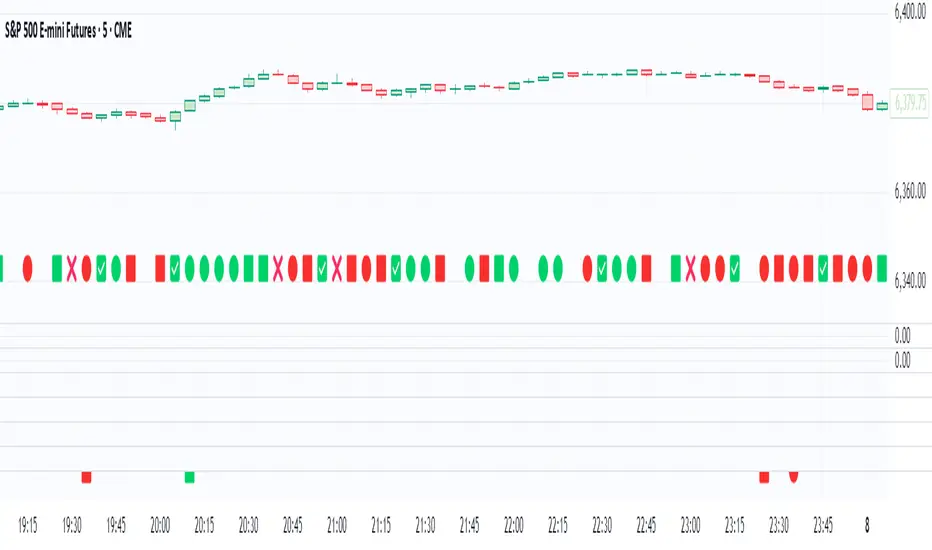
Volume Stack visualizes market bias and momentum for each candle using intuitive emojis in a dedicated bottom pane, keeping your main price chart clean and focused. The indicator analyzes where price closes within each bar’s range to estimate bullish or bearish pressure and highlights key momentum shifts.
Features:
Bullish and Bearish States:
🟩 Green square: Normal bullish candle
🟥 Red square: Normal bearish candle
Strong Bullish/Bearish:
🟢 Green circle: Strong bullish (close near high)
🔴 Red circle: Strong bearish (close near low)
Critical Transitions:
✅ Green checkmark: Bearish → strong bullish (momentum reversal up)
❌ Red cross: Bullish → strong bearish (momentum reversal down)
Easy Visual Scanning:
Emojis plotted in the indicator’s own pane for rapid pattern recognition and clean workflow.
No overlays:
Keeps all symbols off the main price pane.
How it works:
For each candle, the indicator calculates the percentage distance of the close price within the high/low range, then classifies and marks:
Normal bullish/bearish: Basic directional bias
Strong signals: Close is at least 75% toward the high (bullish) or low (bearish)
Transitions: Detects when the market suddenly flips from bullish to strong bearish (❌), or bearish to strong bullish (✅), pinpointing possible inflection points.
This indicator is ideal for traders who want a simple, non-intrusive visualization of intrabar momentum and key reversals—making trend reading and market sentiment effortless.
开源脚本
秉承TradingView的精神,该脚本的作者将其开源,以便交易者可以查看和验证其功能。向作者致敬!您可以免费使用该脚本,但请记住,重新发布代码须遵守我们的网站规则。
免责声明
这些信息和出版物并非旨在提供,也不构成TradingView提供或认可的任何形式的财务、投资、交易或其他类型的建议或推荐。请阅读使用条款了解更多信息。
开源脚本
秉承TradingView的精神,该脚本的作者将其开源,以便交易者可以查看和验证其功能。向作者致敬!您可以免费使用该脚本,但请记住,重新发布代码须遵守我们的网站规则。
免责声明
这些信息和出版物并非旨在提供,也不构成TradingView提供或认可的任何形式的财务、投资、交易或其他类型的建议或推荐。请阅读使用条款了解更多信息。