OPEN-SOURCE SCRIPT
Intraday Mean Reversion Main
The Intraday Mean Reversion Indicator works well on certain stocks. It should be used for day trading stocks but need to be applied on the Day to Day timeframe.
The logic behind the indicator is that stocks that opens substantially lower than yesterdays close, very often bounces back during the day and closes higher than the open price, thus the name Intraday Mean reversal. The stock so to speak, reverses to the mean.
The indicator has 7 levels to choose from:
0.5 * standard deviation
0.6 * standard deviation
0.7 * standard deviation
0.8 * standard deviation
0.9 * standard deviation
1.0 * standard deviation
1.1 * standard deviation
The script can easily be modified to test other levels as well, but according to my experience these levels work the best.
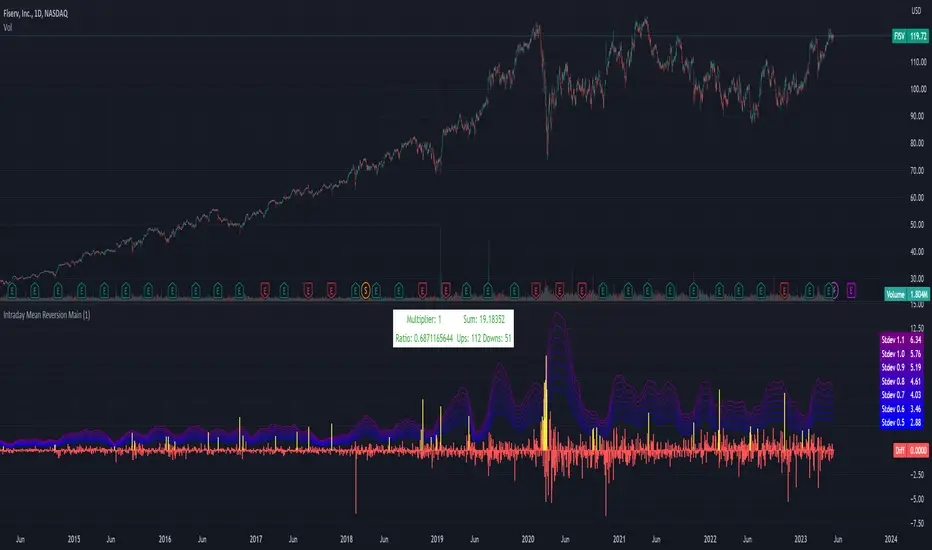
The info box shows the performance of one of these levels, chosen by the user.
Every Yellow bar in the graph shows a buy signal. That is: The stocks open is substantially lower (0.5 - 1.1 standard deviations) than yesterdays close. This means we have a buy signal.
The Multiplier shows which multiplier is chosen, the sum shows the profit following the strategy if ONE stock is bought on every buy signal. The Ratio shows the ratio between winning and losing trades if we followed the strategy historically.
We want to find stocks that have a high ratio and a positive sum. That is More Ups than downs. A ratio over 0.5 is good, but of course we want a margin of safety so, 0.75 is a better choice but harder to find.
If we find a stock that meets our criteria then the strategy will be to buy as early as possible on the open, and sell as close as possible on the close!
The logic behind the indicator is that stocks that opens substantially lower than yesterdays close, very often bounces back during the day and closes higher than the open price, thus the name Intraday Mean reversal. The stock so to speak, reverses to the mean.
The indicator has 7 levels to choose from:
0.5 * standard deviation
0.6 * standard deviation
0.7 * standard deviation
0.8 * standard deviation
0.9 * standard deviation
1.0 * standard deviation
1.1 * standard deviation
The script can easily be modified to test other levels as well, but according to my experience these levels work the best.
The info box shows the performance of one of these levels, chosen by the user.
Every Yellow bar in the graph shows a buy signal. That is: The stocks open is substantially lower (0.5 - 1.1 standard deviations) than yesterdays close. This means we have a buy signal.
The Multiplier shows which multiplier is chosen, the sum shows the profit following the strategy if ONE stock is bought on every buy signal. The Ratio shows the ratio between winning and losing trades if we followed the strategy historically.
We want to find stocks that have a high ratio and a positive sum. That is More Ups than downs. A ratio over 0.5 is good, but of course we want a margin of safety so, 0.75 is a better choice but harder to find.
If we find a stock that meets our criteria then the strategy will be to buy as early as possible on the open, and sell as close as possible on the close!
开源脚本
秉承TradingView的精神,该脚本的作者将其开源,以便交易者可以查看和验证其功能。向作者致敬!您可以免费使用该脚本,但请记住,重新发布代码须遵守我们的网站规则。
免责声明
这些信息和出版物并非旨在提供,也不构成TradingView提供或认可的任何形式的财务、投资、交易或其他类型的建议或推荐。请阅读使用条款了解更多信息。
开源脚本
秉承TradingView的精神,该脚本的作者将其开源,以便交易者可以查看和验证其功能。向作者致敬!您可以免费使用该脚本,但请记住,重新发布代码须遵守我们的网站规则。
免责声明
这些信息和出版物并非旨在提供,也不构成TradingView提供或认可的任何形式的财务、投资、交易或其他类型的建议或推荐。请阅读使用条款了解更多信息。