PROTECTED SOURCE SCRIPT
已更新 Best Range (Day Trading)
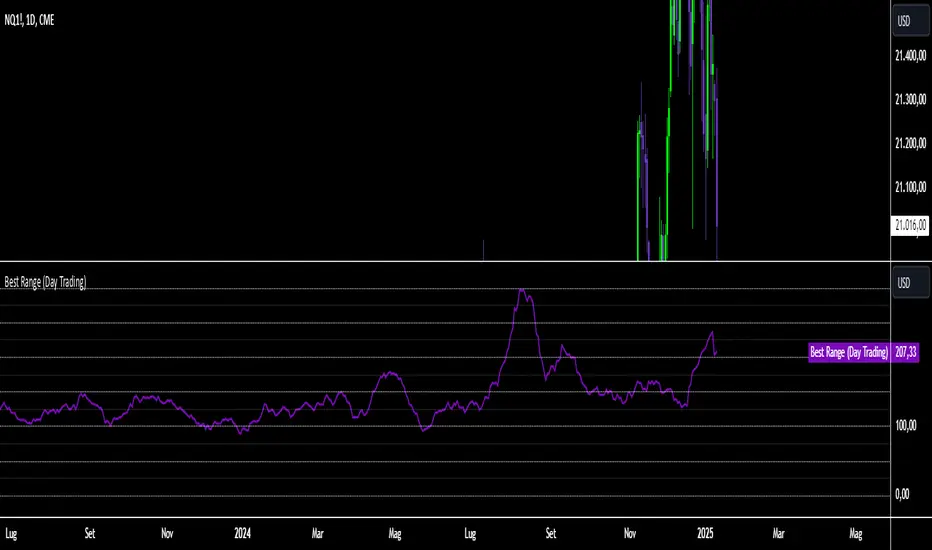
The indicator is based on a formula very similar to that of the ATR. The average volatility of the last candles (a value adjustable via inputs) is calculated, and this value is then divided (a value adjustable via inputs), providing a specific value in terms of RANGE.
Its use is very straightforward. It was primarily designed for stock indices (Nasdaq & SPX). When used on the DAILY timeframe, it provides the recommended RANGE value for day trading with structural logic.
Its goal is to offer a guiding value for setting the chart to a range-based view that is optimal and as effective as possible in identifying breakouts of specific levels, helping traders avoid false breakouts or misleading structures.
We can also observe a division of levels into quartiles (25, 50, 75, 100, 125...). This helps provide reference ranges, allowing the range to be used with rounded numbers.
For example, on Nasdaq, if the indicator set on DAILY provides a value between 200 and 250, then it is advisable to visualize the chart at 200 RANGE for a more aggressive approach or at 250 RANGE for a more conservative approach.
On SPX, which is less volatile, we use increments of 25. If the indicator gives a value between 25 and 50, then we use 25 for an aggressive approach and 50 for a conservative approach.
Obviously, this refers to FUTURES and the tick movements of MINI contracts.
版本注释
NEW VERSION The indicator is based on a formula very similar to that of the ATR. The average volatility of the last candles (a value adjustable via inputs) is calculated, and this value is then divided (a value adjustable via inputs), providing a specific value in terms of RANGE.
Its use is very straightforward. It was primarily designed for stock indices (Nasdaq & SPX). When used on the DAILY timeframe, it provides the recommended RANGE value for day trading with structural logic.
Its goal is to offer a guiding value for setting the chart to a range-based view that is optimal and as effective as possible in identifying breakouts of specific levels, helping traders avoid false breakouts or misleading structures.
We can also observe a division of levels into quartiles (25, 50, 75, 100, 125...). This helps provide reference ranges, allowing the range to be used with rounded numbers.
For example, on Nasdaq, if the indicator set on DAILY provides a value between 200 and 250, then it is advisable to visualize the chart at 200 RANGE for a more aggressive approach or at 250 RANGE for a more conservative approach.
On SPX, which is less volatile, we use increments of 25. If the indicator gives a value between 25 and 50, then we use 25 for an aggressive approach and 50 for a conservative approach.
Obviously, this refers to FUTURES and the tick movements of MINI contracts.
受保护脚本
此脚本以闭源形式发布。 但是,您可以自由使用,没有任何限制 — 了解更多信息这里。
免责声明
这些信息和出版物并非旨在提供,也不构成TradingView提供或认可的任何形式的财务、投资、交易或其他类型的建议或推荐。请阅读使用条款了解更多信息。
受保护脚本
此脚本以闭源形式发布。 但是,您可以自由使用,没有任何限制 — 了解更多信息这里。
免责声明
这些信息和出版物并非旨在提供,也不构成TradingView提供或认可的任何形式的财务、投资、交易或其他类型的建议或推荐。请阅读使用条款了解更多信息。