OPEN-SOURCE SCRIPT
已更新 ES VIX on MNQ
🧭 ES + VIX Overlay on MNQ
This indicator overlays the ES (S&P 500 futures) and VIX (Volatility Index) directly on the MNQ (Micro Nasdaq Futures) chart, allowing traders to visualize in real time the correlation, divergence, and volatility influence between the three instruments.
⸻
⚙️ How It Works
• The VIX is dynamically rescaled to the MNQ’s daily open, so its moves appear on the same price scale.
• The ES line is projected based on its percentage move relative to the session open (18:00 NY).
• Both are plotted in sync with MNQ to expose relative strength and divergence zones that often precede strong directional moves.
⸻
🧩 Inputs
• VIX Symbol: choose between VIX, CBOE:VIX, TVC:VIX
• Invert VIX Correlation: flips the VIX line for inverse-correlation setups
• VIX Step: controls how sensitively the VIX moves on the MNQ scale
• ES Symbol: defines the ES contract (e.g. ES1!)
• Show Signals: toggles on/off buy & sell markers
• Step (points): minimum distance between MNQ and VIX for a valid signal
• Block Signals: disables signals between 16:15 – 03:15 (illiquid hours)
⸻
💡 Signal Logic
The system tracks crossings between MNQ and the projected VIX line:
• Buy signal → when MNQ crosses above the VIX and expands upward by ≥ X points.
• Sell signal → when MNQ crosses below the VIX and expands downward by ≥ X points.
A time filter avoids noise during low-volume sessions.
⸻
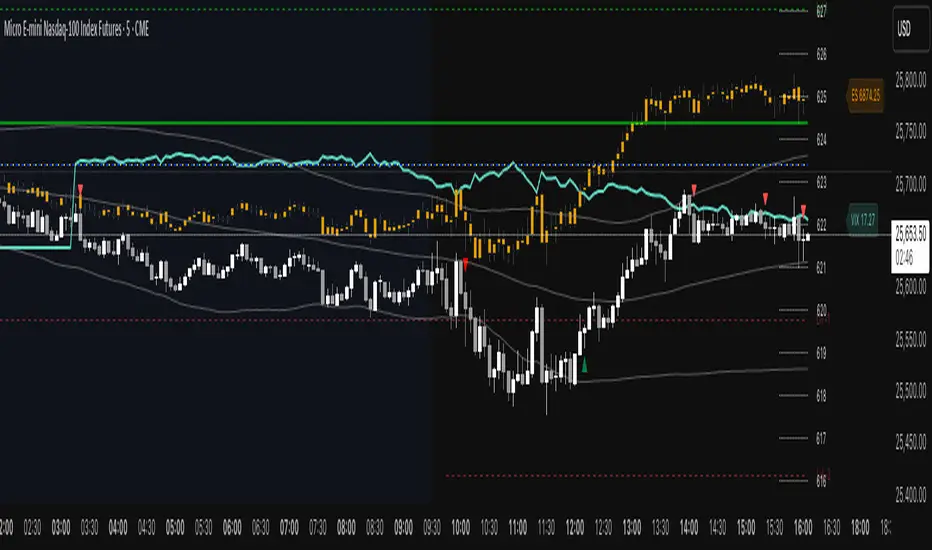
📊 Visual Guide
• Cyan line = VIX on MNQ scale
• Orange line = ES on MNQ scale
• Labels on the right = current VIX / ES values
• BUY/SELL markers = potential volatility-based reversals
⸻
🚀 Practical Use
Perfect for traders who monitor:
• VIX–price divergence
• ES vs MNQ momentum confirmation
• Early volatility expansions before trend moves
⸻
💬 Core Idea:
“Volatility leads — price confirms.”
This indicator overlays the ES (S&P 500 futures) and VIX (Volatility Index) directly on the MNQ (Micro Nasdaq Futures) chart, allowing traders to visualize in real time the correlation, divergence, and volatility influence between the three instruments.
⸻
⚙️ How It Works
• The VIX is dynamically rescaled to the MNQ’s daily open, so its moves appear on the same price scale.
• The ES line is projected based on its percentage move relative to the session open (18:00 NY).
• Both are plotted in sync with MNQ to expose relative strength and divergence zones that often precede strong directional moves.
⸻
🧩 Inputs
• VIX Symbol: choose between VIX, CBOE:VIX, TVC:VIX
• Invert VIX Correlation: flips the VIX line for inverse-correlation setups
• VIX Step: controls how sensitively the VIX moves on the MNQ scale
• ES Symbol: defines the ES contract (e.g. ES1!)
• Show Signals: toggles on/off buy & sell markers
• Step (points): minimum distance between MNQ and VIX for a valid signal
• Block Signals: disables signals between 16:15 – 03:15 (illiquid hours)
⸻
💡 Signal Logic
The system tracks crossings between MNQ and the projected VIX line:
• Buy signal → when MNQ crosses above the VIX and expands upward by ≥ X points.
• Sell signal → when MNQ crosses below the VIX and expands downward by ≥ X points.
A time filter avoids noise during low-volume sessions.
⸻
📊 Visual Guide
• Cyan line = VIX on MNQ scale
• Orange line = ES on MNQ scale
• Labels on the right = current VIX / ES values
• BUY/SELL markers = potential volatility-based reversals
⸻
🚀 Practical Use
Perfect for traders who monitor:
• VIX–price divergence
• ES vs MNQ momentum confirmation
• Early volatility expansions before trend moves
⸻
💬 Core Idea:
“Volatility leads — price confirms.”
版本注释
ES–VIX Overlay on MNQConcept
The ES VIX on MNQ indicator provides a multi-layered view of volatility and index correlation by projecting the behavior of the CBOE VIX and S&P 500 Futures (ES1!) directly onto the Nasdaq Micro Futures (MNQ) chart.
Its goal is to help professional traders visualize how volatility pressure and index divergence affect the intraday behavior of the Nasdaq—transforming complex institutional data into a clear, price-aligned overlay.
⸻
How It Works
1. VIX Projection
• The script calculates the percentage change of the VIX relative to its daily open and re-scales that movement onto the MNQ price axis.
• The result is a dynamic “volatility shadow” that tracks the emotional temperature of the market in real time.
• Because VIX and MNQ tend to move inversely, this projection often reveals early divergences between volatility sentiment and actual price.
2. ES Projection
• Simultaneously, the indicator maps ES (S&P 500 Futures) performance over the same session onto the MNQ chart.
• This exposes cross-index flow—where institutional capital rotates between large-cap (ES) and tech-heavy (MNQ) markets.
• By comparing ES movement against MNQ reaction, traders can detect when Nasdaq strength or weakness is merely following the broader S&P or decoupling from it.
⸻
Dual-Signal Engine
The indicator integrates two independent signaling systems to adapt to both breakout and mean-reversion strategies:
• Touch + Reaction Logic
Detects when MNQ price touches the projected VIX line (within a configurable tolerance) and reacts away from it.
This often marks a short-term exhaustion point or volatility pivot, producing early reversal signals labeled BUY or SELL on the chart.
• Cross Logic
Triggers whenever MNQ price crosses through the VIX projection from one side to the other, confirming momentum shifts and directional continuation setups.
Cross signals are independent from touch signals—each can be enabled or analyzed separately depending on the trader’s methodology.
Both systems can operate simultaneously, offering a clear view of volatility interaction zones versus confirmed trend transitions.
⸻
Additional Institutional Layers
To further contextualize market risk, two optional overlays are included:
• CBOE SKEW Index
Measures the pricing of tail-risk and out-of-the-money options, indicating the degree of institutional hedging and asymmetry in risk perception.
A rising SKEW line implies demand for deep protection—often preceding instability or top formation.
• Put/Call Ratio (PCR)
Quantifies relative options activity between puts and calls.
Extreme PCR readings projected onto the MNQ scale illustrate moments of panic or over-confidence across the options market.
Both layers can be toggled on or off via simple checkboxes, allowing traders to reduce visual complexity or focus solely on volatility correlations.
⸻
Customization & Flexibility
Every component is adjustable:
• Independent scaling for VIX, ES, SKEW, and PCR projections.
• Variable tolerance and reaction windows for signal generation.
• Time-filter controls to restrict signals outside of regular trading hours.
• Full color and styling customization for clear multi-instrument separation.
These parameters make the indicator adaptable to scalp, intraday, or swing strategies, regardless of instrument volatility or timeframe.
⸻
Trading Application
The ES VIX on MNQ overlay is most effective for:
• Spotting early divergence between MNQ price and underlying volatility.
• Confirming institutional positioning through VIX–ES–MNQ alignment.
• Identifying breakout or exhaustion levels where volatility and price converge.
• Enhancing timing precision for mean-reversion or trend-continuation entries.
It effectively translates hidden volatility mechanics into visible structure—helping traders anticipate risk flow before it materializes in price.
⸻
Summary
This is not merely a correlation tool; it’s a volatility-aware market compass.
By projecting the behavior of the VIX, ES, SKEW, and PCR directly onto the MNQ chart, the indicator bridges sentiment, structure, and price action into one unified visual framework.
It empowers traders to recognize when the Nasdaq is following, leading, or resisting institutional volatility—and to act accordingly with confidence and precision.
版本注释
In this new Candle Edition, the ES projection is now displayed as candlesticks rather than a line, allowing clearer visual interpretation of momentum shifts and intermarket divergence. The change from line to candle provides more accurate structure recognition and helps highlight the real dynamics between volatility and index strength.The indicator now also includes dual confirmation signals:
• ES × VIX cross signals, confirming directional shifts between institutional volatility and equity flow.
• MNQ × VIX cross signals, offering direct confirmation from the MNQ price action itself.
Each signal is only validated after the next candle closes in the same direction, reducing noise and improving reliability.
Recommended timeframe 5-minute chart. This timeframe offers the best balance between responsiveness and signal accuracy, effectively filtering out false crossovers that may appear in lower timeframes.
版本注释
.开源脚本
秉承TradingView的精神,该脚本的作者将其开源,以便交易者可以查看和验证其功能。向作者致敬!您可以免费使用该脚本,但请记住,重新发布代码须遵守我们的网站规则。
免责声明
这些信息和出版物并非旨在提供,也不构成TradingView提供或认可的任何形式的财务、投资、交易或其他类型的建议或推荐。请阅读使用条款了解更多信息。
免责声明
这些信息和出版物并非旨在提供,也不构成TradingView提供或认可的任何形式的财务、投资、交易或其他类型的建议或推荐。请阅读使用条款了解更多信息。