OPEN-SOURCE SCRIPT
Market Structure Trend Targets [ChartPrime]

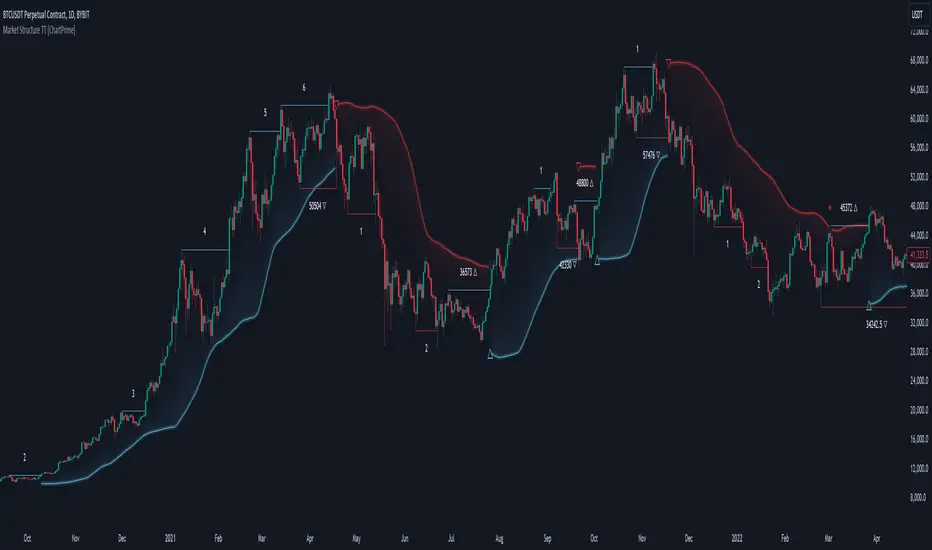
The Market Structure Trend Targets [ChartPrime] indicator is designed to identify trend direction and continuation points by marking significant breaks in price levels. This approach helps traders track trend strength and potential reversal points. The indicator uses previous highs and lows as breakout triggers, providing a visual roadmap for trend continuation or mean reversion signals.
⯁ KEY FEATURES AND HOW TO USE
⯁ USER INPUTS
⯁ CONCLUSION
The Market Structure Trend Targets [ChartPrime] indicator offers a strategic way to monitor market trends, track breakouts, and manage risk through dynamic stop loss levels. Its clear visual representation of trend continuity, alongside mean reversion signals, provides traders with actionable insights for both trend-following and counter-trend strategies.
⯁ KEY FEATURES AND HOW TO USE
- ⯌ Breakout Points with Numbered Markers:
The indicator identifies key breakout points where price breaks above a previous high (for uptrends) or below a previous low (for downtrends). The initial breakout (zero break) is marked with the entry price and a triangle icon, while subsequent breakouts within the trend are numbered sequentially (1, 2, 3…) to indicate trend continuation.
Example of breakout markers for uptrend and downtrend: - ⯌ Percentage Change Display Option:
Traders can toggle on a setting to display the percentage change from the initial breakout point to each subsequent break level, offering an easy way to gauge trend momentum over time. This is particularly helpful for identifying how far price has moved in the current trend.
Percentage change example between break points: - ⯌ Dynamic Stop Loss Levels:
In uptrends, the stop loss level is placed below the price to protect against downside moves. In downtrends, it is positioned above the price. If the price breaches the stop loss level, the indicator resets, indicating a potential end or reversal of the trend.
Dynamic stop loss level illustration in uptrend and downtrend: - ⯌ Mean Reversion Signals:
The indicator identifies potential mean reversion points with diamond icons. In an uptrend, if the price falls below the stop loss and then re-enters above it, a diamond is plotted, suggesting a possible mean reversion. Similarly, in a downtrend, if the price moves above the stop loss and then falls back below, it indicates a reversion possibility.
Mean reversion diamond signals on the chart: - ⯌ Trend Visualization with Colored Zones:
The chart background is shaded to visually represent trend direction, with color changes corresponding to uptrends and downtrends. This makes it easier to see overall market conditions at a glance.
⯁ USER INPUTS
- Length: Defines the number of bars used to identify pivot highs and lows for trend breakouts.
- Display Percentage: Option to toggle between showing sequential breakout numbers or the percentage change from the initial breakout.
- Colors for Uptrend and Downtrend: Allows customization of color zones for uptrends and downtrends to match individual chart preferences.
⯁ CONCLUSION
The Market Structure Trend Targets [ChartPrime] indicator offers a strategic way to monitor market trends, track breakouts, and manage risk through dynamic stop loss levels. Its clear visual representation of trend continuity, alongside mean reversion signals, provides traders with actionable insights for both trend-following and counter-trend strategies.
开源脚本
秉承TradingView的精神,该脚本的作者将其开源,以便交易者可以查看和验证其功能。向作者致敬!您可以免费使用该脚本,但请记住,重新发布代码须遵守我们的网站规则。
免责声明
这些信息和出版物并非旨在提供,也不构成TradingView提供或认可的任何形式的财务、投资、交易或其他类型的建议或推荐。请阅读使用条款了解更多信息。
开源脚本
秉承TradingView的精神,该脚本的作者将其开源,以便交易者可以查看和验证其功能。向作者致敬!您可以免费使用该脚本,但请记住,重新发布代码须遵守我们的网站规则。
免责声明
这些信息和出版物并非旨在提供,也不构成TradingView提供或认可的任何形式的财务、投资、交易或其他类型的建议或推荐。请阅读使用条款了解更多信息。