OPEN-SOURCE SCRIPT
Parabolic SAR BY CARLOZ
🔹 What is the Parabolic SAR?
The Parabolic SAR (developed by Welles Wilder) is a trend-following indicator used to identify potential entry and exit points in the market.
🔹 What does “SAR” mean?
SAR = Stop And Reverse.
It suggests where to place a stop loss and also indicates when to reverse a position (from long to short or short to long).
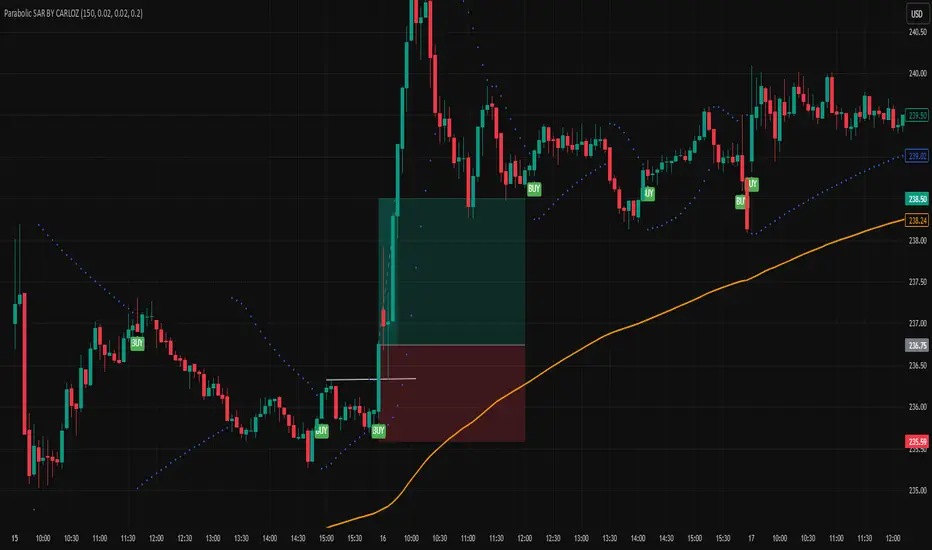
🔹 How does it look on the chart?
It appears as a series of dots above or below the price:
Dots below price → bullish signal (uptrend).
Dots above price → bearish signal (downtrend).
The Parabolic SAR (developed by Welles Wilder) is a trend-following indicator used to identify potential entry and exit points in the market.
🔹 What does “SAR” mean?
SAR = Stop And Reverse.
It suggests where to place a stop loss and also indicates when to reverse a position (from long to short or short to long).
🔹 How does it look on the chart?
It appears as a series of dots above or below the price:
Dots below price → bullish signal (uptrend).
Dots above price → bearish signal (downtrend).
开源脚本
秉承TradingView的精神,该脚本的作者将其开源,以便交易者可以查看和验证其功能。向作者致敬!您可以免费使用该脚本,但请记住,重新发布代码须遵守我们的网站规则。
免责声明
这些信息和出版物并非旨在提供,也不构成TradingView提供或认可的任何形式的财务、投资、交易或其他类型的建议或推荐。请阅读使用条款了解更多信息。
开源脚本
秉承TradingView的精神,该脚本的作者将其开源,以便交易者可以查看和验证其功能。向作者致敬!您可以免费使用该脚本,但请记住,重新发布代码须遵守我们的网站规则。
免责声明
这些信息和出版物并非旨在提供,也不构成TradingView提供或认可的任何形式的财务、投资、交易或其他类型的建议或推荐。请阅读使用条款了解更多信息。