OPEN-SOURCE SCRIPT
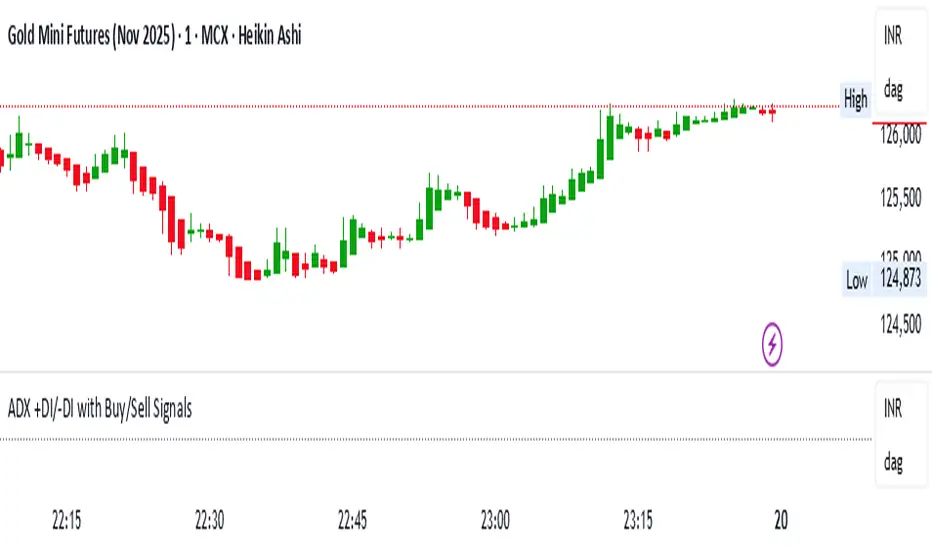
ADX +DI/-DI with Buy/Sell Signals
//version=5
indicator("ADX +DI/-DI with Buy/Sell Signals", overlay=true)
// Inputs
adxLength = input.int(14, "ADX Length")
threshold = input.float(25.0, "ADX Threshold")
// Directional Movement
upMove = ta.change(high)
downMove = -ta.change(low)
plusDM = (upMove > downMove and upMove > 0) ? upMove : 0.0
minusDM = (downMove > upMove and downMove > 0) ? downMove : 0.0
// True Range and Smoothed Values
tr = ta.rma(ta.tr, adxLength)
plusDI = 100 * ta.rma(plusDM, adxLength) / tr
minusDI = 100 * ta.rma(minusDM, adxLength) / tr
dx = 100 * math.abs(plusDI - minusDI) / (plusDI + minusDI)
adx = ta.rma(dx, adxLength)
// Buy/Sell Conditions
buySignal = ta.crossover(plusDI, minusDI) and adx > threshold
sellSignal = ta.crossover(minusDI, plusDI) and adx > threshold
// Plot Buy/Sell markers
plotshape(buySignal, title="BUY", location=location.belowbar,
color=color.new(color.lime, 0), style=shape.triangleup, size=size.large, text="BUY")
plotshape(sellSignal, title="SELL", location=location.abovebar,
color=color.new(color.red, 0), style=shape.triangledown, size=size.large, text="SELL")
// Optional ADX + DI lines (hidden by default)
plot(adx, title="ADX", color=color.yellow, linewidth=2, display=display.none)
plot(plusDI, title="+DI", color=color.green, display=display.none)
plot(minusDI, title="-DI", color=color.red, display=display.none)
hline(threshold, "ADX Threshold", color=color.gray, linestyle=hline.style_dotted)
// Alerts
alertcondition(buySignal, title="BUY Alert", message="ADX Buy Signal Triggered")
alertcondition(sellSignal, title="SELL Alert", message="ADX Sell Signal Triggered")
开源脚本
本着TradingView的真正精神,此脚本的创建者将其开源,以便交易者可以查看和验证其功能。向作者致敬!虽然您可以免费使用它,但请记住,重新发布代码必须遵守我们的网站规则。
免责声明
这些信息和出版物并不意味着也不构成TradingView提供或认可的金融、投资、交易或其它类型的建议或背书。请在使用条款阅读更多信息。
开源脚本
本着TradingView的真正精神,此脚本的创建者将其开源,以便交易者可以查看和验证其功能。向作者致敬!虽然您可以免费使用它,但请记住,重新发布代码必须遵守我们的网站规则。
免责声明
这些信息和出版物并不意味着也不构成TradingView提供或认可的金融、投资、交易或其它类型的建议或背书。请在使用条款阅读更多信息。