OPEN-SOURCE SCRIPT
Market State Indicator with Precise ADF
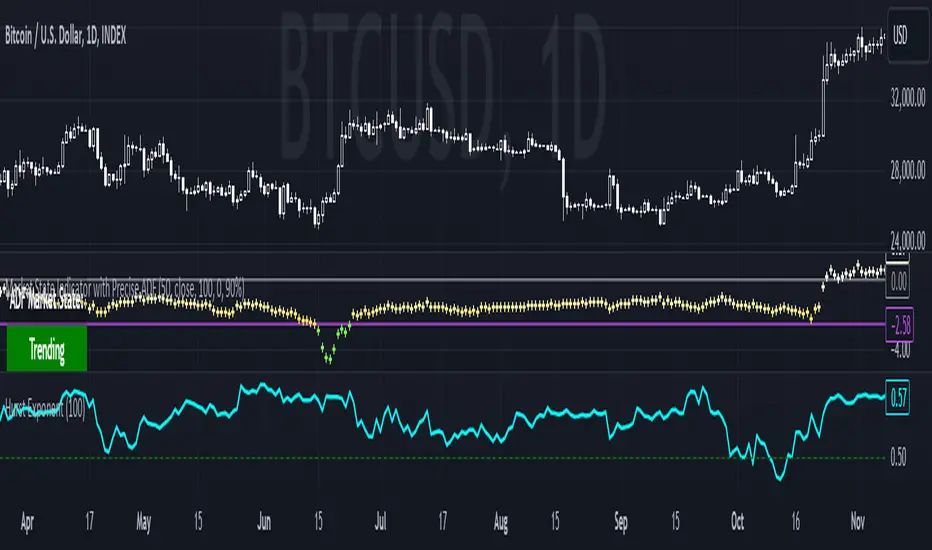
This script combines the Hurst Exponent and Augmented Dickey-Fuller (ADF) Test to help traders identify market states—whether the market is trending, mean-reverting, or in a random walk. By analyzing both statistical tools together, traders can gain deeper insights into the underlying market dynamics, allowing them to make more informed decisions.
Code Explanation:
Hurst Exponent Calculation:
The script calculates the Hurst Exponent over a customizable length. A Hurst value above 0.5 suggests a trending market, below 0.5 indicates a mean-reverting market, and around 0.5 suggests a random walk. The Hurst Exponent is plotted as a cyan line with a green threshold line at 0.5.
Augmented Dickey-Fuller (ADF) Test Implementation:
The ADF test is a statistical test used to determine if a time series is stationary (mean-reverting) or non-stationary (trending). The script calculates the ADF test statistic (tauADF) and compares it to a critical value (crit) based on the chosen confidence level (90%, 95%, 99%). If the test statistic is below the critical value, it suggests mean-reversion (green cross); above the critical value suggests trending (red cross).
The ADF result is plotted as a cross with color indicating its state: green for mean-reverting, red for trending, and white/yellow gradients for in-between states.
Market State Detection:
The script determines the market state by comparing the Hurst Exponent and ADF Test results. If both suggest trending, the market is likely in a strong trend. If both suggest mean-reversion, the market is likely mean-reverting. When the indicators are close to the critical thresholds (purple for mean-reversion, grey for trending), the market exhibits characteristics of those states, even if it doesn’t definitively cross the threshold.
If the readings are somewhere in the middle, the market might be in a random walk state, lacking a clear trend or mean-reversion.
Visualization:
The script provides an option to display the market state as boxes on the chart. The Hurst Market State Box indicates whether the Hurst Exponent suggests a trending or mean-reverting market, while the ADF Market State Box shows the same for the ADF test. Green indicates a mean-reverting market, and red indicates trending.
Use Case: This script is designed to be a powerful confluence tool, combining the Hurst Exponent and ADF Test to give traders a robust analysis of market conditions. While the script may not always provide a definitive market state, the proximity of the ADF statistic to its critical value and the Hurst Exponent's indication help traders gauge the likelihood of trending, mean-reverting, or random walk behavior, aiding in better decision-making.
By using this tool, traders can quantitatively assess market conditions and adjust their strategies accordingly, whether they favor trend-following, mean-reversion, or need to be cautious during random walk phases.
开源脚本
秉承TradingView的精神,该脚本的作者将其开源,以便交易者可以查看和验证其功能。向作者致敬!您可以免费使用该脚本,但请记住,重新发布代码须遵守我们的网站规则。
免责声明
这些信息和出版物并非旨在提供,也不构成TradingView提供或认可的任何形式的财务、投资、交易或其他类型的建议或推荐。请阅读使用条款了解更多信息。
开源脚本
秉承TradingView的精神,该脚本的作者将其开源,以便交易者可以查看和验证其功能。向作者致敬!您可以免费使用该脚本,但请记住,重新发布代码须遵守我们的网站规则。
免责声明
这些信息和出版物并非旨在提供,也不构成TradingView提供或认可的任何形式的财务、投资、交易或其他类型的建议或推荐。请阅读使用条款了解更多信息。