INVITE-ONLY SCRIPT
Trend and verser AI indicator V1.01
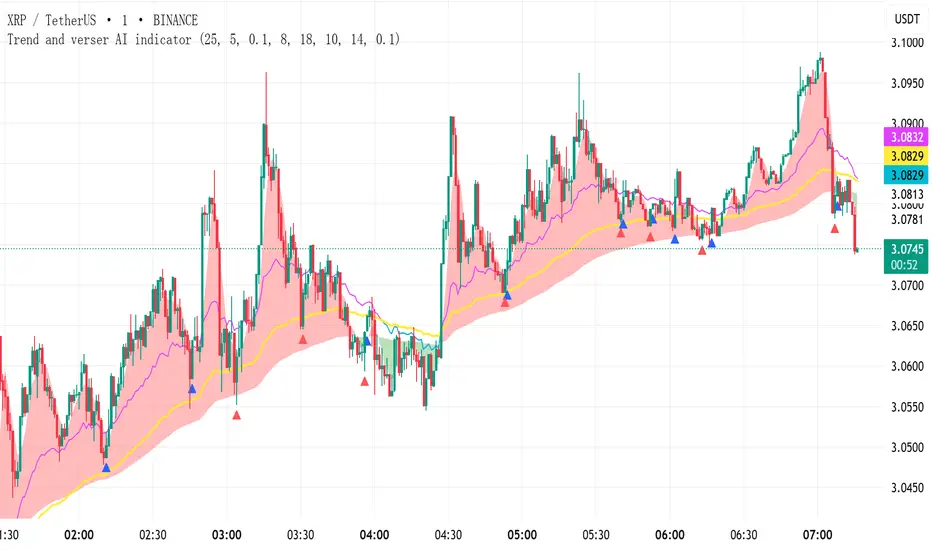
Declaration: NO REPAINTING, NO LAG, NO DISPLACEMENT – SIGNALS NEVER DISAPPEAR!
Indicator Usage Guide (Simple & Effective):
(1) Red Zone + UP Arrow → Go LONG
(2) Green Zone + DOWN Arrow → Go SHORT
(3) Alternating Red/Green Zones → Consolidation Phase (NO TRADING!)
Default parameters are optimized for reliable signals but can be customized as needed.
Instructions:
(1) This indicator is suitable for any trading instrument (stocks, futures, forex, cryptocurrencies, options, etc.) and any timeframe (minutes, hours, days, weeks, months).
(2) The indicator only provides entry signals (buy/sell signals). It does not provide exit signals. Profitability depends entirely on your holding period. This indicator does not guarantee profits.
(3) Arrows come in Red and Blue, representing two different signal types. Red signals may provide more precise reversal points on the candlestick chart compared to Blue signals.
(4) The indicator plots three distinct trend lines: a Red trend line, a Green trend line, and a Yellow trend line.
(5) * When the Red trend line is ABOVE the Yellow trend line, it signifies a Bullish (uptrend) market,consider taking LONG positions based on arrow signals.
* When the Green trend line is BELOW the Yellow trend line, it signifies a Bearish (downtrend) market,consider taking SHORT positions based on arrow signals.
* When the Red and Green trend lines are ALTERNATING (crossing frequently), it signifies a Ranging (sideways/consolidation) market, arrow signals are less reliable during this phase, and trading is NOT recommended.
仅限邀请脚本
只有作者授权的用户才能访问此脚本。您需要申请并获得使用许可。通常情况下,付款后即可获得许可。更多详情,请按照下方作者的说明操作,或直接联系zhushanshao。
TradingView不建议您付费购买或使用任何脚本,除非您完全信任其作者并了解其工作原理。您也可以在我们的社区脚本找到免费的开源替代方案。
作者的说明
Buyers please leave a message.
免责声明
这些信息和出版物并非旨在提供,也不构成TradingView提供或认可的任何形式的财务、投资、交易或其他类型的建议或推荐。请阅读使用条款了解更多信息。
仅限邀请脚本
只有作者授权的用户才能访问此脚本。您需要申请并获得使用许可。通常情况下,付款后即可获得许可。更多详情,请按照下方作者的说明操作,或直接联系zhushanshao。
TradingView不建议您付费购买或使用任何脚本,除非您完全信任其作者并了解其工作原理。您也可以在我们的社区脚本找到免费的开源替代方案。
作者的说明
Buyers please leave a message.
免责声明
这些信息和出版物并非旨在提供,也不构成TradingView提供或认可的任何形式的财务、投资、交易或其他类型的建议或推荐。请阅读使用条款了解更多信息。