OPEN-SOURCE SCRIPT
已更新 MACD XD

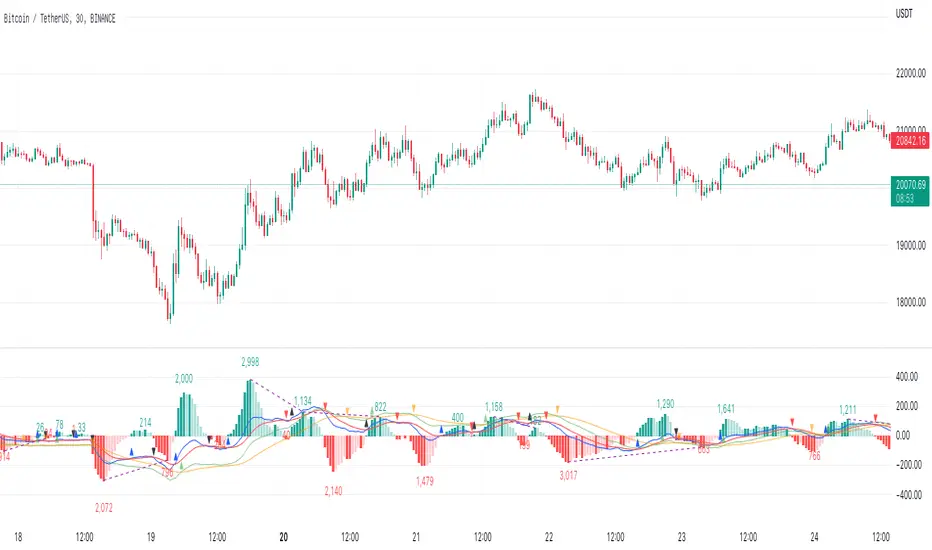
This indicator is based on the classic MACD indicator, and with the following additional features:
1. Another set of MACD and signal lines (green and orange) is added for analyzing a bigger trend in a higher time frame. The default set of MACD and signal lines (red and blue) are used for the smaller trend (current time frame).
2. Small upward and downward triangles are added to mark the golden and death crosses of MACD and signal lines: Blue and red triangles (buy and sell signals) - golden and death crosses of MACD and signal lines for the smaller trend (current time frame), green and orange triangles (buy and sell signals) - golden and death crosses of MACD and signal lines for the bigger trend (a higher time frame).
3. The total areas of histograms above and below the MACD zero axis are calculated and shown by the numbers next to the histogram. This information can be used to analyze the top and bottom divergences of the smaller trend (current time frame).
4. A line connecting peaks of adjacent positive or negative histograms is drawn when top and bottom divergences occur, which indicates a potential trend reversal.
This indicator can be used in the following way: after a golden cross occurs in the bigger trend (green arrow), a death cross in the smaller trend (red arrow) may lead to a potential long entry at the pull back of the bigger up trend; after a death cross occurs in the bigger trend (orange arrow), a golden cross in the smaller trend (blue arrow) may lead to a potential short entry at the pull back of the bigger down trend. Note that in general, golden crosses occur when MACD and signal lines are above the zero axis means a higher high will be made, and death crosses occur when MACD and signal lines are below the zero axis means a lower low will be made. On the contrary, golden crosses occurring below the zero axis or death crosses occurring above the zero axis may only lead to a potential pull back in a trend.
本指标基于经典的MACD指标,适合与缠论指标结合使用:
1. 加入第二组MACD线和信号线,适用于辅助判断缠论中的线段背离。
2. 加入计算直方图(红绿柱子)面积的部分,有助于判断缠论中的笔背离。
3. 标注出两组MACD线与信号线的金叉死叉,以及用特殊颜色表示零轴上方金叉和零轴下方死叉的情况。
4. 用直线标注出顶底背离发生的情况,利于准确分辨和判断。
版本注释
增加了修改 MACD 线、信号线和直方图显示比例的选项。将两个参数均设置为1可恢复原始 MACD 设置。版本注释
1. 增加了一些选项的显示开关,2. 增加了显示顶底的标签(顶底由背离计算得出),3. 增加了出现顶底时的警报:在警报设置里选择 MACD XD,再选择“顶底信号”,注意自行注明警报的币种和周期等信息。注:最好不要只用顶底信号作为出入场依据。
版本注释
将“顶”、“底”改为了“空”、“多”,为了避免误导。版本注释
1. 调整了背离的判断条件,2. 修改了面积倍数的参数设置,为应对小币种面积显示为零的问题。版本注释
增加了一些显示设置的选项。版本注释
增加了调整面积显示位置的选项。版本注释
1. 更改了级别的称谓,2. 更改了高级别MACD和信号线参数的默认数值,即高级别参数为本级别参数的5-6倍,为满足缠论中不同级别之间的关系。版本注释
增加了零轴线(可在样式设置里关闭显示)。版本注释
增加了本级别和高级别 MACD 金叉死叉的警报。版本注释
增加了显示MACD背景色的选项(可在“样式”设置里隐藏)。版本注释
增加了提示红绿柱力度变化的警报。版本注释
修改了红绿柱力度变化警报的设置。版本注释
Update due to conflict of interest. Contact the author for the source code.开源脚本
秉承TradingView的精神,该脚本的作者将其开源,以便交易者可以查看和验证其功能。向作者致敬!您可以免费使用该脚本,但请记住,重新发布代码须遵守我们的网站规则。
免责声明
这些信息和出版物并非旨在提供,也不构成TradingView提供或认可的任何形式的财务、投资、交易或其他类型的建议或推荐。请阅读使用条款了解更多信息。
开源脚本
秉承TradingView的精神,该脚本的作者将其开源,以便交易者可以查看和验证其功能。向作者致敬!您可以免费使用该脚本,但请记住,重新发布代码须遵守我们的网站规则。
免责声明
这些信息和出版物并非旨在提供,也不构成TradingView提供或认可的任何形式的财务、投资、交易或其他类型的建议或推荐。请阅读使用条款了解更多信息。