Supply and Demand
Overview:
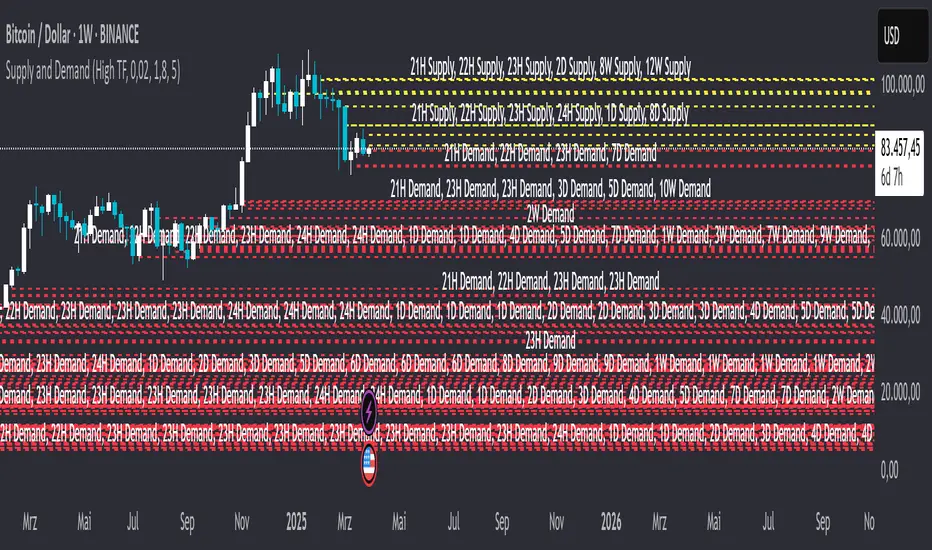
This TradingView indicator is based on an innovative method for identifying Supply & Demand (S&D) zones. Unlike traditional methods that highlight broad areas, making precise trading difficult, this indicator allows for more accurate determination of key price levels. It combines classic S&D analysis with Fibonacci adjustments to identify institutional order blocks and probable turning points.
Functionality:
Identification of S&D Zones:
The indicator automatically detects key areas where major market participants ("Smart Money") have placed significant orders, causing strong price movements.
These areas represent untested orders that could be revisited in the future.
Supply zones indicate selling areas, while demand zones define buying areas.
Consideration of Candle Structure:
The number of candles within the consolidation phase influences the strength of a zone: the more candles present, the more significant the area.
Higher timeframes (e.g., 5D, 1W, 1M) provide more robust and reliable S&D zones as they reflect institutional activity.
All relevant levels are visible within a single timeframe, eliminating the need to switch between multiple timeframes.
Fibonacci Integration for Precision:
Instead of traditionally applying the Fibonacci retracement tool between swing highs and lows, it is unconventionally used here: from the open to the close of the candle preceding the impulse move.
This calculates an "Equilibrium Point" within the zone, serving as an optimal entry level.
Visual Representation:
The indicator highlights detected supply and demand zones with distinct colors.
A thin line marks the precise equilibrium point within the zone.
Particularly strong zones with a high probability of reaction are marked more intensely.
Important Notes:
The indicator is not a "holy grail" and is not a 100% foolproof method.
S&D zones are probabilistic and can fail despite all confluence factors.
It provides a solid, backtested strategy for identifying trading areas with high accuracy and efficiency.
Additional Features:
Customizable timeframes and sensitivity parameters
Option to mark historical S&D zones
Support for various asset classes (Crypto, Forex, Stocks)
Customizeable Deviation
Merging levels
This indicator is a valuable tool for traders looking to develop precise entry and exit strategies based on institutional order blocks.
- Correct labeling Supply and Demands
- Add minor step to configure label merge threshold
- dont show high mitigated S&D
- Add min percentage value for engulfing candle
- Set default value of min bb size to 0
- Lables sometimes not shown correctly if merged
- Shorten the name of the Hidden Liquidity level for more readablility
- change default settings
- Implemented Supply and Demand Ranges
- Implement setting linestyle for a solid line
- add setting for max number of candles be analysed in the past (applies on every chart checked, higher timeframes are analyzed further into the past than lower ones with the same number of candles)
- add possiblility to show complete Supply/Demand as box
-bugfix when drawing boxes
仅限邀请脚本
Only users approved by the author can access this script. You'll need to request and get permission to use it. This is typically granted after payment. For more details, follow the author's instructions below or contact HiddenLiquidty directly.
TradingView does NOT recommend paying for or using a script unless you fully trust its author and understand how it works. You may also find free, open-source alternatives in our community scripts.
作者的说明
免责声明
仅限邀请脚本
Only users approved by the author can access this script. You'll need to request and get permission to use it. This is typically granted after payment. For more details, follow the author's instructions below or contact HiddenLiquidty directly.
TradingView does NOT recommend paying for or using a script unless you fully trust its author and understand how it works. You may also find free, open-source alternatives in our community scripts.