INVITE-ONLY SCRIPT
Opening Range Intraday Indicator
Opening Range Intraday Indicator
Summary
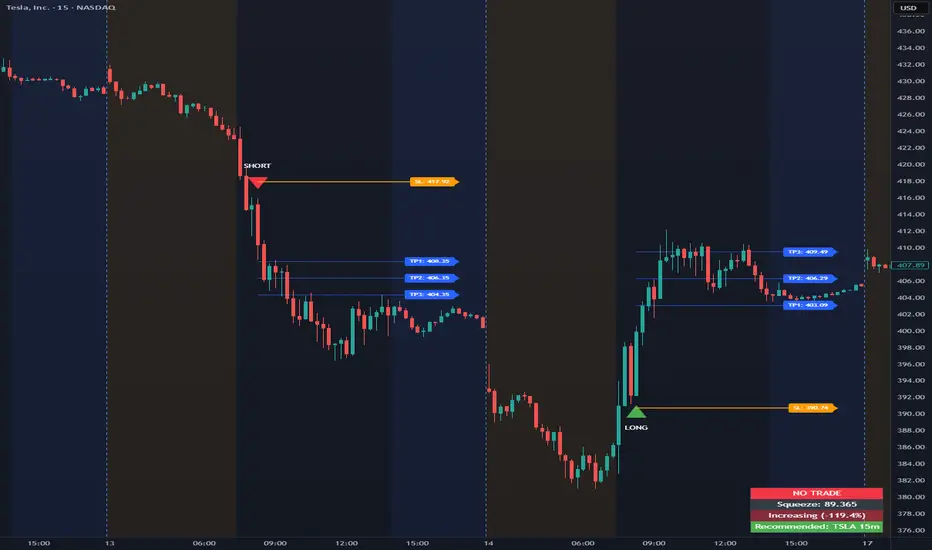
The Opening Range Intraday Indicator is a decision-support tool for intraday breakout entries. It combines an Opening Range Breakout (ORB) model with relative volume confirmation and a squeeze-style trend filter, then visualizes entries with clearly defined take-profit (TP) and stop-loss (SL) levels.
The indicator works on any ticker and any timeframe. However, its default parameters and internal logic are optimized for TSLA on the 15-minute chart, which is shown as a recommended context in the on-chart table for informational purposes only.
Core Logic
Opening Range Breakout
Establishes an opening range during the early session and monitors for confirmed breakouts above or below that range to generate potential intraday entries.
Relative Volume confirmation
Breakouts are validated using relative volume to help ensure participation and reduce low-quality signals during thin or inactive periods.
Squeeze / trend filter
A squeeze-style metric evaluates recent compression and directional behavior, helping to avoid entries during unfavorable or low-quality structural conditions.
Entry Visualization & Risk Levels
When a valid entry is confirmed, the indicator automatically:
Plots directional entry markers
Calculates and draws multiple take-profit levels
Draws a stop-loss level based on opening-range structure or ATR logic
Marks TP or SL hits directly on the chart for visual review
These visuals persist on the chart to allow traders to manually review trade structure and outcome over time.
On-Chart Table & Context Guidance
The indicator includes a compact on-chart table that displays:
Current squeeze value and short-term trend behavior
“No trade” conditions when structure is unfavorable
A recommended context message indicating whether the chart matches the optimized setup (TSLA on the 15-minute timeframe)
This message is informational only and does not restrict signals or functionality on other symbols or timeframes.
Flexibility & Controls
Users can customize:
Take-profit and stop-loss display behavior
Tight or standard stop-loss logic
Quiet windows near session close to suppress alerts
Visual settings and table positioning
This allows the indicator to be adapted to different instruments, volatility profiles, and execution styles.
Important Notes
This indicator does not execute trades and does not include automated backtesting or performance statistics.
TP/SL markers are visual aids only and are intended for manual review, not statistical validation.
Results will vary by symbol, timeframe, execution, and market conditions.
This indicator is intended as a research and decision-support tool for experienced intraday traders who understand execution risk, volatility, and position sizing. It should be used alongside proper risk management and independent analysis.
Summary
The Opening Range Intraday Indicator is a decision-support tool for intraday breakout entries. It combines an Opening Range Breakout (ORB) model with relative volume confirmation and a squeeze-style trend filter, then visualizes entries with clearly defined take-profit (TP) and stop-loss (SL) levels.
The indicator works on any ticker and any timeframe. However, its default parameters and internal logic are optimized for TSLA on the 15-minute chart, which is shown as a recommended context in the on-chart table for informational purposes only.
Core Logic
Opening Range Breakout
Establishes an opening range during the early session and monitors for confirmed breakouts above or below that range to generate potential intraday entries.
Relative Volume confirmation
Breakouts are validated using relative volume to help ensure participation and reduce low-quality signals during thin or inactive periods.
Squeeze / trend filter
A squeeze-style metric evaluates recent compression and directional behavior, helping to avoid entries during unfavorable or low-quality structural conditions.
Entry Visualization & Risk Levels
When a valid entry is confirmed, the indicator automatically:
Plots directional entry markers
Calculates and draws multiple take-profit levels
Draws a stop-loss level based on opening-range structure or ATR logic
Marks TP or SL hits directly on the chart for visual review
These visuals persist on the chart to allow traders to manually review trade structure and outcome over time.
On-Chart Table & Context Guidance
The indicator includes a compact on-chart table that displays:
Current squeeze value and short-term trend behavior
“No trade” conditions when structure is unfavorable
A recommended context message indicating whether the chart matches the optimized setup (TSLA on the 15-minute timeframe)
This message is informational only and does not restrict signals or functionality on other symbols or timeframes.
Flexibility & Controls
Users can customize:
Take-profit and stop-loss display behavior
Tight or standard stop-loss logic
Quiet windows near session close to suppress alerts
Visual settings and table positioning
This allows the indicator to be adapted to different instruments, volatility profiles, and execution styles.
Important Notes
This indicator does not execute trades and does not include automated backtesting or performance statistics.
TP/SL markers are visual aids only and are intended for manual review, not statistical validation.
Results will vary by symbol, timeframe, execution, and market conditions.
This indicator is intended as a research and decision-support tool for experienced intraday traders who understand execution risk, volatility, and position sizing. It should be used alongside proper risk management and independent analysis.
仅限邀请脚本
只有作者授权的用户才能访问此脚本。您需要申请并获得使用许可。通常情况下,付款后即可获得许可。更多详情,请按照下方作者的说明操作,或直接联系T_I_M_E。
TradingView不建议您付费购买或使用任何脚本,除非您完全信任其作者并了解其工作原理。您也可以在我们的社区脚本找到免费的开源替代方案。
作者的说明
For access to the indicator, please visit https://whop.com/t-i-m-e-indicators To watch how to use this and other indicators, please visit http://www.youtube.com/@T.I.M.E_Indicators
免责声明
这些信息和出版物并非旨在提供,也不构成TradingView提供或认可的任何形式的财务、投资、交易或其他类型的建议或推荐。请阅读使用条款了解更多信息。