OPEN-SOURCE SCRIPT
已更新 Volume Crop ━ Hidden Volume Divergence [whvntr]
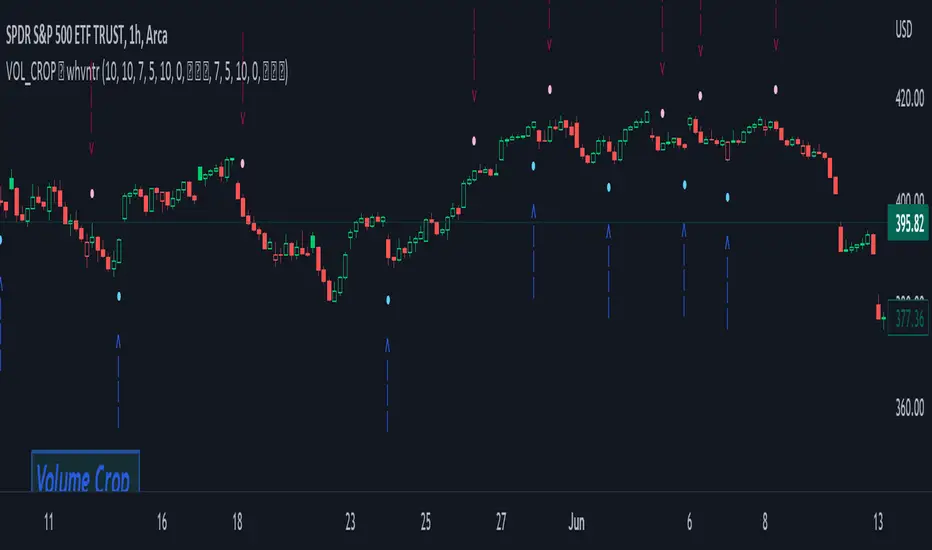
Volume Divergence
• Formula originated from: "Hidden Price Divergence" (circles) by TheLark. I did two things to harness its
effectiveness:
• Firstly, I developed a unique way to filter out the divergence signals that were appearing on both sides of the
midline. This filter will be known as the "Midline Tool". It filters out a lot of the false signals commonly
associated with oscillators.
• Then, I modified the default format from Price to Volume.
• The midline formula "Midline Tool" was developed by me [whvntr]. It adjusts in the thousands since it's volume.
Let me know in the comments if you would rater have a smaller step value than 10,000. How does it work?
Crossover then Crossunder, the arrows only appear during the first sign of hidden volume divergence once
crossing the midline. Normally, these signs appear on both side of the midline both bearish and bullish no
matter if it's on an oversold or overbought side of the spectrum... Also, let
me know in the comments if you would like for me to release an oscillator version of this
indicator for co-witnessing.
Features:
• Volume divergence
• Midline Tool©
• Disclaimer: This indicator does not constitute investment advice. Trade at your own risk with the investments
you can afford to lose because all financial investments have risks and this is not a
guarantee that the volume divergence will be 100% all the time.
版本注释
Tooltips版本注释
Alerts added 版本注释
Conditions updated版本注释
Updated Alerts版本注释
Future updates coming版本注释
Updated repainting conditions 版本注释
Alerts tested and active. To use: click 🕘Alert + Condition + VOL_CROP + Trigger: "Once Per Bar Close"版本注释
Alerts in maintenance版本注释
Depiction of how it works:https://www.tradingview.com/x/tWUWvwPY/
版本注释
MACD lengths updated to 7 & 5 from 26 & 12. If you wish to keep the original settings, you may adjust them in the Inputs menu. 开源脚本
秉承TradingView的精神,该脚本的作者将其开源,以便交易者可以查看和验证其功能。向作者致敬!您可以免费使用该脚本,但请记住,重新发布代码须遵守我们的网站规则。
免责声明
这些信息和出版物并非旨在提供,也不构成TradingView提供或认可的任何形式的财务、投资、交易或其他类型的建议或推荐。请阅读使用条款了解更多信息。
免责声明
这些信息和出版物并非旨在提供,也不构成TradingView提供或认可的任何形式的财务、投资、交易或其他类型的建议或推荐。请阅读使用条款了解更多信息。