OPEN-SOURCE SCRIPT
5-8-13 + AVWAP + Fibonacci FULL Sistem (Temiz & Profesyonel)
✅ What This Indicator Is Doing (Full Explanation in English)
Your custom system combines several powerful components:
EMA 5-8-13,
AVWAP,
Auto Fibonacci,
Triple-Confirmation Buy/Sell Signals,
Background Trend Coloring.
Below is the complete breakdown.
🟩 1. Trend Detection with EMA 5-8-13
The indicator colors the background based on the alignment of:
EMA 5
EMA 8
EMA 13
Trend logic:
Uptrend (Green background):
EMA5 > EMA8 > EMA13
Downtrend (Red background):
EMA5 < EMA8 < EMA13
Caution Zone (Brown/Orange):
EMA5 < EMA8 but EMA8 > EMA13
→ Trend weakening, prepare for reversal.
🟩 2. Classic Buy/Sell Signals (EMA Cross)
These labels are the small “AL” and “SAT” signals.
BUY: EMA 5 crosses above EMA 13
SELL: EMA 5 crosses below EMA 13
This captures basic trend reversals.
🟩 3. AVWAP Dip/Peak Detection
The indicator automatically finds significant swing points:
AVWAP DIP (Green small label)
AVWAP PEAK (Red small label)
It then launches a new AVWAP line starting from that pivot.
So the yellow line is always the current Anchored VWAP starting from the most recent important DIP or PEAK.
🟩 4. Auto Fibonacci Levels (Clean Version)
The indicator calculates Fibonacci levels based on the last N bars (120 by default):
0.0
0.236
0.382
0.500
0.618
0.786
1.0
You now use the clean version, meaning:
✔ Only one set of Fibonacci lines appears
✔ No overlapping lines
✔ No chart clutter
✔ Always readable and minimal
🟩 5. Triple-Confirmation Buy/Sell Signals (Strong Signals)
These are the more important green/red labels (“🔥 AL” / “⚠️ SAT”).
A TRIPLE BUY (AL) happens when:
Price breaks above AVWAP
EMA 5-8-13 are aligned upward (trendUp)
Price is above Fibonacci 0.382
A TRIPLE SELL (SAT) happens when:
Price breaks below AVWAP
EMA 5-8-13 aligned downward (trendDown)
Price is below Fibonacci 0.382
This removes weak signals and gives high-quality entries and exits.
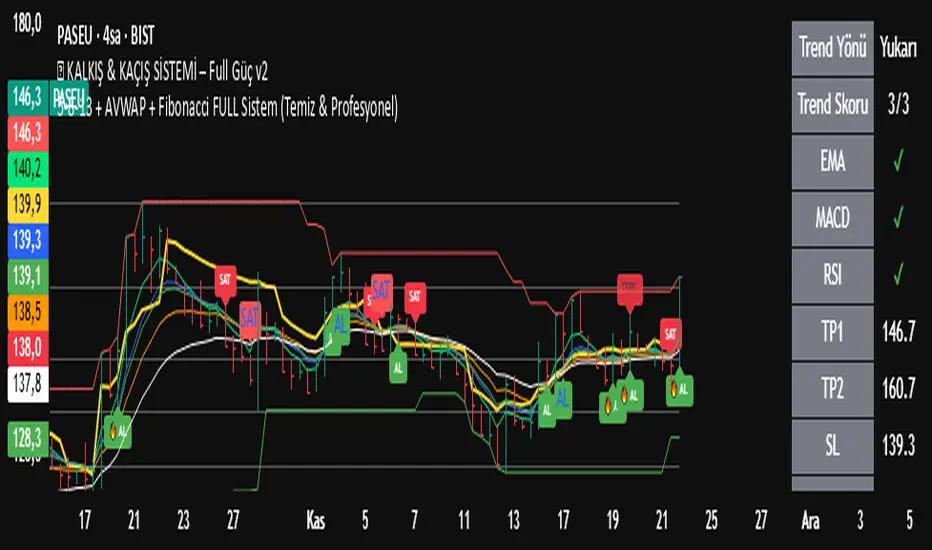
🟩 Summary of What You Saw on the Chart
Trend shifted to caution zone
Then EMA trend fully turned bearish
Price broke below AVWAP
Price dropped below Fibonacci 0.382
Triple Confirmation Sell appeared
Downtrend continued strongly afterward
Your indicator correctly identified:
👉 Trend weakening
👉 Bearish reversal
👉 Strong Sell zone
👉 Final drop
Your custom system combines several powerful components:
EMA 5-8-13,
AVWAP,
Auto Fibonacci,
Triple-Confirmation Buy/Sell Signals,
Background Trend Coloring.
Below is the complete breakdown.
🟩 1. Trend Detection with EMA 5-8-13
The indicator colors the background based on the alignment of:
EMA 5
EMA 8
EMA 13
Trend logic:
Uptrend (Green background):
EMA5 > EMA8 > EMA13
Downtrend (Red background):
EMA5 < EMA8 < EMA13
Caution Zone (Brown/Orange):
EMA5 < EMA8 but EMA8 > EMA13
→ Trend weakening, prepare for reversal.
🟩 2. Classic Buy/Sell Signals (EMA Cross)
These labels are the small “AL” and “SAT” signals.
BUY: EMA 5 crosses above EMA 13
SELL: EMA 5 crosses below EMA 13
This captures basic trend reversals.
🟩 3. AVWAP Dip/Peak Detection
The indicator automatically finds significant swing points:
AVWAP DIP (Green small label)
AVWAP PEAK (Red small label)
It then launches a new AVWAP line starting from that pivot.
So the yellow line is always the current Anchored VWAP starting from the most recent important DIP or PEAK.
🟩 4. Auto Fibonacci Levels (Clean Version)
The indicator calculates Fibonacci levels based on the last N bars (120 by default):
0.0
0.236
0.382
0.500
0.618
0.786
1.0
You now use the clean version, meaning:
✔ Only one set of Fibonacci lines appears
✔ No overlapping lines
✔ No chart clutter
✔ Always readable and minimal
🟩 5. Triple-Confirmation Buy/Sell Signals (Strong Signals)
These are the more important green/red labels (“🔥 AL” / “⚠️ SAT”).
A TRIPLE BUY (AL) happens when:
Price breaks above AVWAP
EMA 5-8-13 are aligned upward (trendUp)
Price is above Fibonacci 0.382
A TRIPLE SELL (SAT) happens when:
Price breaks below AVWAP
EMA 5-8-13 aligned downward (trendDown)
Price is below Fibonacci 0.382
This removes weak signals and gives high-quality entries and exits.
🟩 Summary of What You Saw on the Chart
Trend shifted to caution zone
Then EMA trend fully turned bearish
Price broke below AVWAP
Price dropped below Fibonacci 0.382
Triple Confirmation Sell appeared
Downtrend continued strongly afterward
Your indicator correctly identified:
👉 Trend weakening
👉 Bearish reversal
👉 Strong Sell zone
👉 Final drop
开源脚本
秉承TradingView的精神,该脚本的作者将其开源,以便交易者可以查看和验证其功能。向作者致敬!您可以免费使用该脚本,但请记住,重新发布代码须遵守我们的网站规则。
Telegram kanalımızdakı sinyaller ücretsizdir.
免责声明
这些信息和出版物并非旨在提供,也不构成TradingView提供或认可的任何形式的财务、投资、交易或其他类型的建议或推荐。请阅读使用条款了解更多信息。
开源脚本
秉承TradingView的精神,该脚本的作者将其开源,以便交易者可以查看和验证其功能。向作者致敬!您可以免费使用该脚本,但请记住,重新发布代码须遵守我们的网站规则。
Telegram kanalımızdakı sinyaller ücretsizdir.
免责声明
这些信息和出版物并非旨在提供,也不构成TradingView提供或认可的任何形式的财务、投资、交易或其他类型的建议或推荐。请阅读使用条款了解更多信息。