OPEN-SOURCE SCRIPT
Volume scaled Price + auto colour change light/dark mode
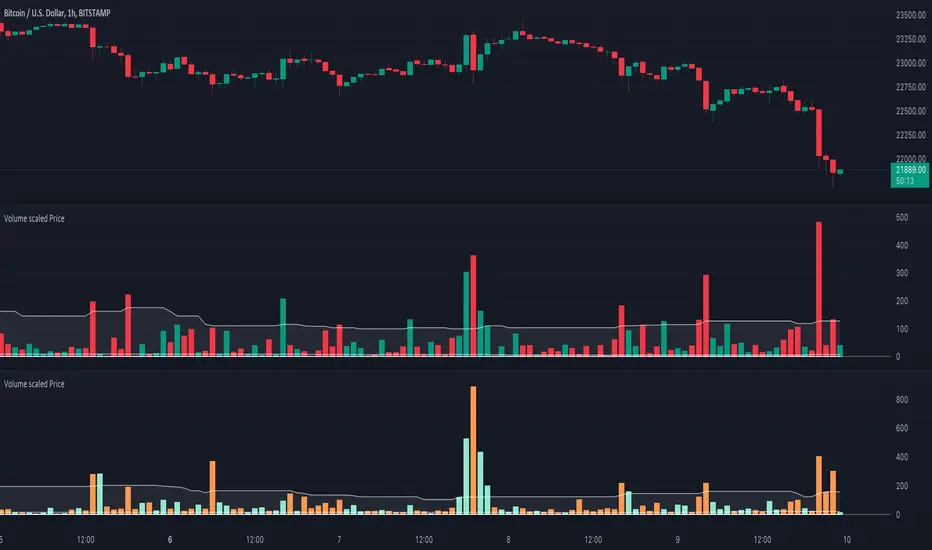
🔶 OVERVIEW
🔹 This script shows price in a similar style as volume. To accomplish this we use the body of the candle (close-open), which is placed on a zero line.

This can be useful when comparing volume ~ price.
🔹 3 options are included to show additional lines, to make comparisons easier:
· Percentile nearest rank
· Bollinger Bands (BB)
· Simple Moving Average (SMA)
🔶 SETTINGS
🔹 Option: choose whether to show price (candles) or volume . Adding 2 versions of this indicator on the chart enables you to compare these 2 options:

🔹 Lines:
· (Percentile nearest rank (only the setting mult is used for this option).

· Bollinger Bands (BB) (only the setting % perc. nearest rank is used for this option).

· Simple Moving Average (SMA )

All 3 options will use length, this is the amount of bars used for calculations.
🔹 Show wick will show you... wicks :)
🔶 PERCENTILE NEAREST RANK


🔹 This script has 2 extra types of background color
Pine Script®
· In this case:
· volume is higher than previous volume (volume > volume[1])
· volume is above 90th percentile rank (volume > prV)
· price is lower than previous price (z < z[1])
· price is below 10th percentile rank (z < prP_)


Pine Script®
· The second type background color is reversed (volume lower, price higher)

🔶 AUTOMATIC COLOUR CHANGE WHEN SWITCHING DARK/LIGHT MODE
🔹 chart.bg_color returns the color of the chart’s background from the "Chart settings/Appearance/Background" field, while chart.fg_color returns a color providing optimal contrast with chart.bg_color.
· Following technique gives you the possibility to pick your own colour for either dark/light time.
· We first retrieve separately the red, green and blue component of the measured chart.bg_color
Pine Script®
The following assumption states when all 3 colour components' values are below 80, we are in the dark mode:
Pine Script®
Now we can use isDark to automatically show your own dark/light mode colours (chosen at settings), dependable on the mode:


Cheers!
🔹 This script shows price in a similar style as volume. To accomplish this we use the body of the candle (close-open), which is placed on a zero line.
This can be useful when comparing volume ~ price.
🔹 3 options are included to show additional lines, to make comparisons easier:
· Percentile nearest rank
· Bollinger Bands (BB)
· Simple Moving Average (SMA)
🔶 SETTINGS
🔹 Option: choose whether to show price (candles) or volume . Adding 2 versions of this indicator on the chart enables you to compare these 2 options:
🔹 Lines:
· (Percentile nearest rank (only the setting mult is used for this option).
· Bollinger Bands (BB) (only the setting % perc. nearest rank is used for this option).
· Simple Moving Average (SMA )
All 3 options will use length, this is the amount of bars used for calculations.
🔹 Show wick will show you... wicks :)
🔶 PERCENTILE NEAREST RANK
🔹 This script has 2 extra types of background color
dvP = volume > volume [1] and z < z [1] and z < prP_ and volume > prV
· In this case:
· volume is higher than previous volume (volume > volume[1])
· volume is above 90th percentile rank (volume > prV)
· price is lower than previous price (z < z[1])
· price is below 10th percentile rank (z < prP_)
dvV = volume < volume [1] and z > z [1] and z > prP and volume < prV_
· The second type background color is reversed (volume lower, price higher)
🔶 AUTOMATIC COLOUR CHANGE WHEN SWITCHING DARK/LIGHT MODE
🔹 chart.bg_color returns the color of the chart’s background from the "Chart settings/Appearance/Background" field, while chart.fg_color returns a color providing optimal contrast with chart.bg_color.
· Following technique gives you the possibility to pick your own colour for either dark/light time.
· We first retrieve separately the red, green and blue component of the measured chart.bg_color
r = color.r(chart.bg_color)
g = color.g(chart.bg_color)
b = color.b(chart.bg_color)
The following assumption states when all 3 colour components' values are below 80, we are in the dark mode:
isDark = r < 80 and g < 80 and b < 80
Now we can use isDark to automatically show your own dark/light mode colours (chosen at settings), dependable on the mode:
Cheers!
开源脚本
秉承TradingView的精神,该脚本的作者将其开源,以便交易者可以查看和验证其功能。向作者致敬!您可以免费使用该脚本,但请记住,重新发布代码须遵守我们的网站规则。
Who are PineCoders?
tradingview.com/chart/SSP/yW5eOqtm-Who-are-PineCoders/
TG Pine Script® Q&A: t.me/PineCodersQA
- We cannot control our emotions,
but we can control our keyboard -
tradingview.com/chart/SSP/yW5eOqtm-Who-are-PineCoders/
TG Pine Script® Q&A: t.me/PineCodersQA
- We cannot control our emotions,
but we can control our keyboard -
免责声明
这些信息和出版物并非旨在提供,也不构成TradingView提供或认可的任何形式的财务、投资、交易或其他类型的建议或推荐。请阅读使用条款了解更多信息。