OPEN-SOURCE SCRIPT
90-Day Beta to BTC
Overview:
The 90-Day Beta to BTC indicator measures the volatility of a specific token relative to Bitcoin (BTC) over the past 90 days. Beta is a widely used statistical measure in financial markets that indicates how much a token's price moves in relation to BTC. A higher beta means the token is more volatile compared to BTC, while a lower beta means it is less volatile or moves similarly to BTC.
How It Works:
This indicator calculates the daily logarithmic returns of both the token and Bitcoin, then computes the covariance between their returns and the variance of Bitcoin’s returns. The resulting Beta value reflects the degree to which the token’s price fluctuates relative to Bitcoin's price over the past 90 days.
Beta > 1: The token is more volatile than Bitcoin, showing higher price swings.
Beta = 1: The token moves in lockstep with Bitcoin, exhibiting similar volatility.
Beta < 1: The token is less volatile than Bitcoin, showing smaller price fluctuations.
Beta = 0: The token's price movement is uncorrelated with Bitcoin’s price.
Negative Beta: The token moves opposite to Bitcoin, indicating an inverse relationship.
Use Case:
This indicator is particularly useful for traders or investors looking to identify tokens with high speculative volatility. Tokens with Beta values above 1 are typically high-risk, high-reward assets, often driven by hype, social trends, or market speculation. Conversely, tokens with Beta values below 1 offer a more stable price relationship with Bitcoin, making them less volatile and potentially safer.
In the context of a Trash Token Tournament, tokens with a higher Beta (greater than 1) may be more attractive due to their heightened volatility and potential for larger price swings, making them the “wild cards” of the market.
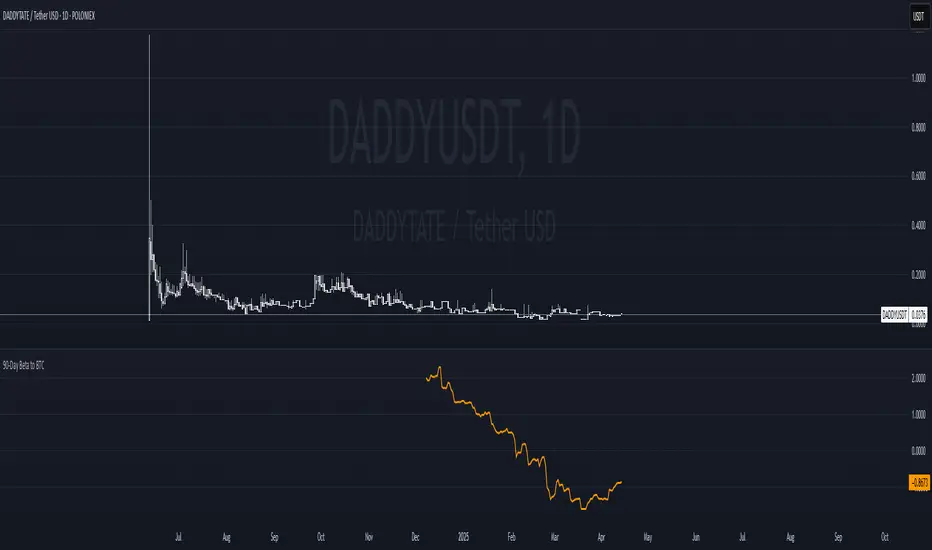
Visual Representation:
The Beta value is plotted as a line chart beneath the main price chart, offering a visual representation of the token’s volatility relative to Bitcoin over the last 90 days. Spikes in Beta indicate periods of increased volatility, while drops suggest stability.
The 90-Day Beta to BTC indicator measures the volatility of a specific token relative to Bitcoin (BTC) over the past 90 days. Beta is a widely used statistical measure in financial markets that indicates how much a token's price moves in relation to BTC. A higher beta means the token is more volatile compared to BTC, while a lower beta means it is less volatile or moves similarly to BTC.
How It Works:
This indicator calculates the daily logarithmic returns of both the token and Bitcoin, then computes the covariance between their returns and the variance of Bitcoin’s returns. The resulting Beta value reflects the degree to which the token’s price fluctuates relative to Bitcoin's price over the past 90 days.
Beta > 1: The token is more volatile than Bitcoin, showing higher price swings.
Beta = 1: The token moves in lockstep with Bitcoin, exhibiting similar volatility.
Beta < 1: The token is less volatile than Bitcoin, showing smaller price fluctuations.
Beta = 0: The token's price movement is uncorrelated with Bitcoin’s price.
Negative Beta: The token moves opposite to Bitcoin, indicating an inverse relationship.
Use Case:
This indicator is particularly useful for traders or investors looking to identify tokens with high speculative volatility. Tokens with Beta values above 1 are typically high-risk, high-reward assets, often driven by hype, social trends, or market speculation. Conversely, tokens with Beta values below 1 offer a more stable price relationship with Bitcoin, making them less volatile and potentially safer.
In the context of a Trash Token Tournament, tokens with a higher Beta (greater than 1) may be more attractive due to their heightened volatility and potential for larger price swings, making them the “wild cards” of the market.
Visual Representation:
The Beta value is plotted as a line chart beneath the main price chart, offering a visual representation of the token’s volatility relative to Bitcoin over the last 90 days. Spikes in Beta indicate periods of increased volatility, while drops suggest stability.
开源脚本
秉承TradingView的精神,该脚本的作者将其开源,以便交易者可以查看和验证其功能。向作者致敬!您可以免费使用该脚本,但请记住,重新发布代码须遵守我们的网站规则。
免责声明
这些信息和出版物并非旨在提供,也不构成TradingView提供或认可的任何形式的财务、投资、交易或其他类型的建议或推荐。请阅读使用条款了解更多信息。
免责声明
这些信息和出版物并非旨在提供,也不构成TradingView提供或认可的任何形式的财务、投资、交易或其他类型的建议或推荐。请阅读使用条款了解更多信息。