OPEN-SOURCE SCRIPT
JSE Market Breadth Stocks>MA
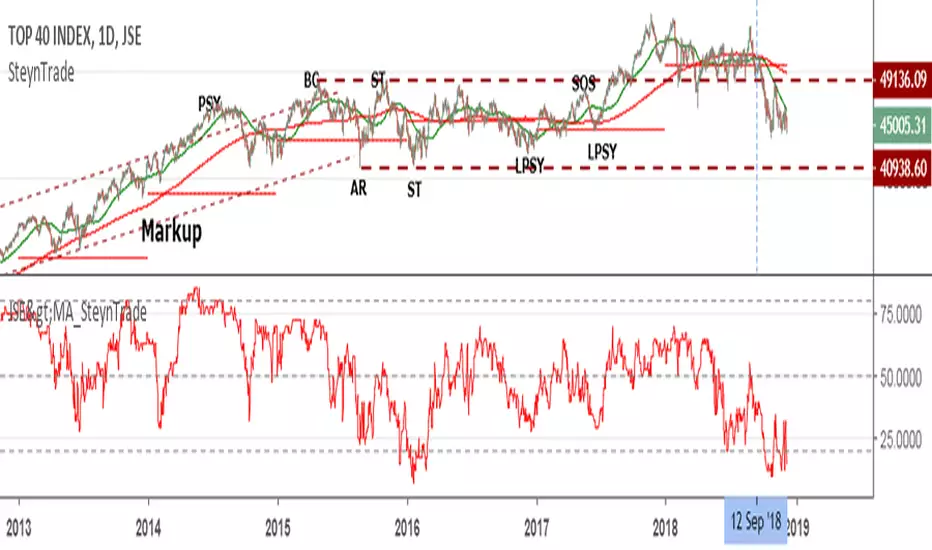
This indicator is for the Johannesburg Stock Exchange (JSE) and indicates the number of stocks in the Top 40 Index above its selected Smooth Moving Average (SMA). Typically the 200SMA is used to see the longer term health of the market and the 50SMA for a short term view. Currently the market has reached a point that less than 2% of stocks were above their 200SMA which is the lowest since 2013.
开源脚本
秉承TradingView的精神,该脚本的作者将其开源,以便交易者可以查看和验证其功能。向作者致敬!您可以免费使用该脚本,但请记住,重新发布代码须遵守我们的网站规则。
免责声明
这些信息和出版物并非旨在提供,也不构成TradingView提供或认可的任何形式的财务、投资、交易或其他类型的建议或推荐。请阅读使用条款了解更多信息。
开源脚本
秉承TradingView的精神,该脚本的作者将其开源,以便交易者可以查看和验证其功能。向作者致敬!您可以免费使用该脚本,但请记住,重新发布代码须遵守我们的网站规则。
免责声明
这些信息和出版物并非旨在提供,也不构成TradingView提供或认可的任何形式的财务、投资、交易或其他类型的建议或推荐。请阅读使用条款了解更多信息。