PROTECTED SOURCE SCRIPT
Delta Edge
At Inertia Trading Systems, we are excited to introduce our latest release, the Delta Edge indicator. Designed specifically for traders using TradingView, Delta Edge makes reading delta simpler and more intuitive, giving you a clearer understanding of market dynamics in real-time. Whether you're a seasoned trader or just starting out, Delta Edge offers a streamlined way to monitor buying and selling pressure, helping you make more informed trading decisions with ease.
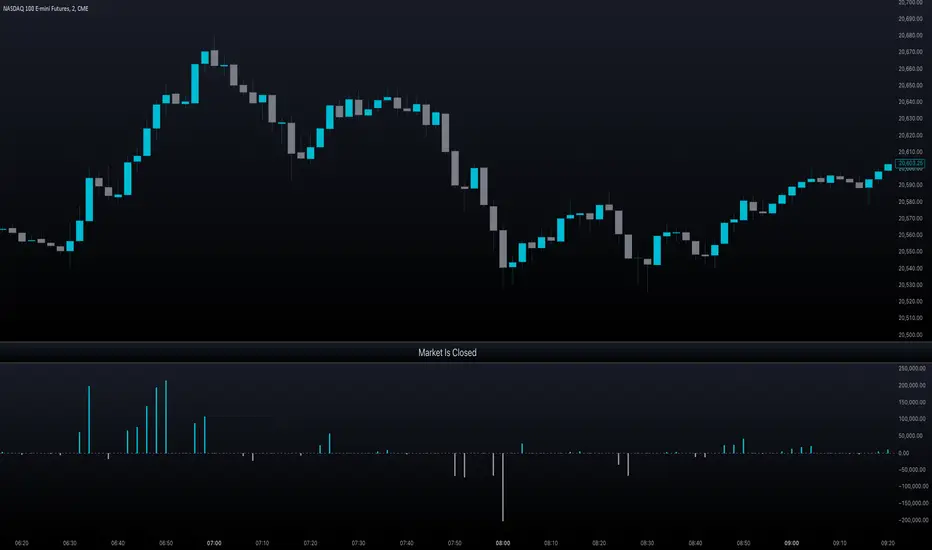
The "Delta Edge" indicator calculates and plots cumulative delta, which tracks the net difference between buy and sell volume in futures trading. This gives traders insight into market sentiment by showing the underlying buying or selling pressure.
-Delta represents the difference between buy and sell volume: positive delta means more buying, while negative delta shows more selling pressure.
-The cumulative delta shifts when the market moves from buying to selling (or vice versa), helping identify potential trend reversals.
-A color-coded histogram (green for positive, red for negative) visually represents these shifts in market pressure.
Traders often use delta to gauge whether the market is likely to continue in a certain direction or reverse, depending on the strength of buying or selling pressure. This tool is particularly valuable for intraday traders and scalpers who focus on short-term price movements, as it helps them understand the underlying order flow driving the market.
Additionally, the indicator is effective in detecting divergences between price action and order flow. For example, if price is making higher highs but delta is decreasing (indicating weakening buying pressure), it may signal a bearish divergence and a potential reversal. These divergences help traders spot hidden market strength or weakness, making the indicator a powerful tool for assessing future market moves.
受保护脚本
此脚本以闭源形式发布。 但是,您可以自由使用,没有任何限制 — 了解更多信息这里。
Futures | Automation
免责声明
这些信息和出版物并非旨在提供,也不构成TradingView提供或认可的任何形式的财务、投资、交易或其他类型的建议或推荐。请阅读使用条款了解更多信息。
受保护脚本
此脚本以闭源形式发布。 但是,您可以自由使用,没有任何限制 — 了解更多信息这里。
Futures | Automation
免责声明
这些信息和出版物并非旨在提供,也不构成TradingView提供或认可的任何形式的财务、投资、交易或其他类型的建议或推荐。请阅读使用条款了解更多信息。