INVITE-ONLY SCRIPT
已更新 STOH‴ | Stocastic Histogram
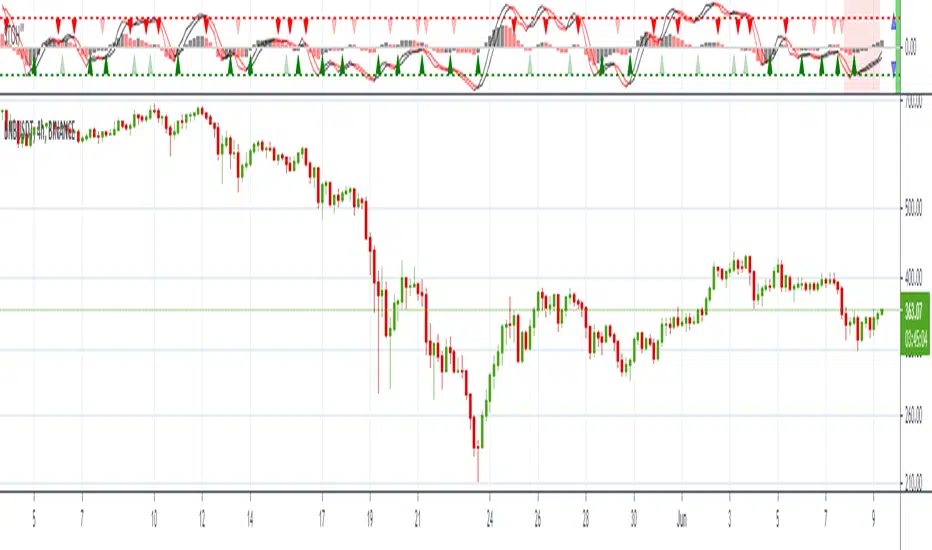
STOH‴ our Stochastic Histogram is a Stochastic oscillator as the original one but this one that allows you to have a better understanding and interpretation of its behavior once you are able to:
1. see colored lines when it changes its direction;
2. see colored arrow upward/downward when the %K line crossover/crossunder the %D line;
3. see colored histogram, and additional sign as of in the MACDH indicator;
4. see the indicator with Ordinary or Directional Momentum OHLC values;
5. far right side of the indicator shows bars to that provides the buy/sell signal status:
- the right side bar shows if the indicator is on an upward (green color) or downward (red color) full trend for both lines and histogram;
- the left side bar shows if the indicator's trend is being threatened (yellow color).
- a par of arrows provide the trader the sense of histogram current bar Expansion bias (point top-up and bottom-down) or Contraction bias (point top-down and bottom-up)
p.s.: notice that this version of the indicator has different overbought/oversold zone levels due to the histogram that fluctuates the zero line.
Believe me, this indicator will make your life much easier!
To have access to this indicator, please contact DM me.
版本注释
Some new features:1. ability to set the timeframe the indicator will present eventhough in a different timeframe window;
2. light red background presented every time the Volatility is activated in the indicator's timeframe.
仅限邀请脚本
只有作者授权的用户才能访问此脚本。您需要申请并获得使用许可。通常情况下,付款后即可获得许可。更多详情,请按照下方作者的说明操作,或直接联系MarceloTorres。
TradingView不建议您付费购买或使用任何脚本,除非您完全信任其作者并了解其工作原理。您也可以在我们的社区脚本找到免费的开源替代方案。
作者的说明
If you are interested in this indicator, please DM me.
Don't contact me in the comment area.
TRADEWISER | Marcelo Torres
marcelo@tradewiser.pro
Vídeo-Análise completa diária no YouTube:
youtube.com/c/TradeWiserPro
Curso/AE
CursoAE.TradeWiser.pro
@TradeWiserPro
Telegram, Twitter, Facebook, LinkedIn, Instagram
marcelo@tradewiser.pro
Vídeo-Análise completa diária no YouTube:
youtube.com/c/TradeWiserPro
Curso/AE
CursoAE.TradeWiser.pro
@TradeWiserPro
Telegram, Twitter, Facebook, LinkedIn, Instagram
免责声明
这些信息和出版物并非旨在提供,也不构成TradingView提供或认可的任何形式的财务、投资、交易或其他类型的建议或推荐。请阅读使用条款了解更多信息。