OPEN-SOURCE SCRIPT
Relative Price Oscillator
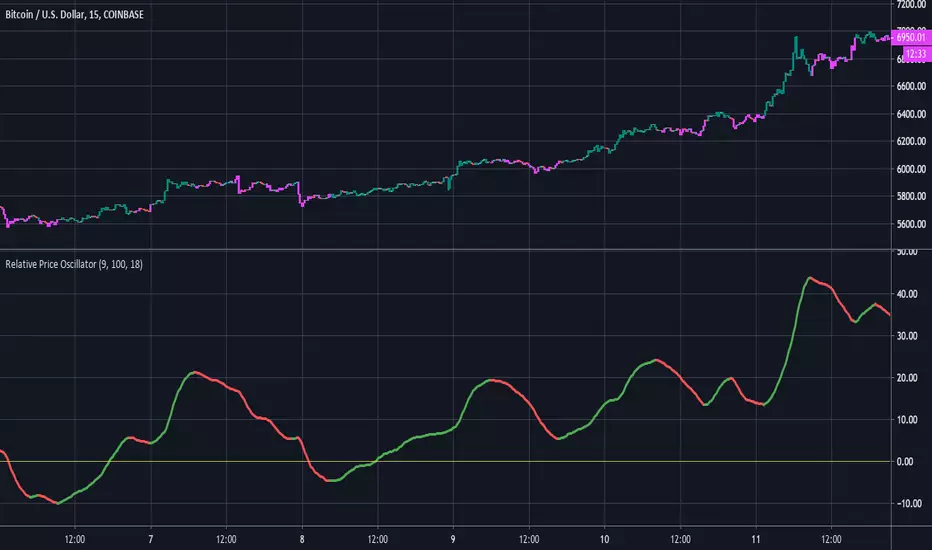
Here is a new experimental indicator we've been working on. The idea was to compare two EMA's of period midpoints to the actual closing price. The steps that were taken are listed below:
1.Calculate an EMA based on each period's midpoint ((High * Low) /2) for the last 9 periods.
2.Calculate an EMA based on each period's midpoint for the last 100 periods.
3. Divide the difference of the two EMA's by the closing price. ((EMA1 - EMA2) / Close).
4. Smooth the value from step #3 with an 18 period EMA. Multiply by 1000 for better scaling/visibility.
Using:
Bullish when line is green, bearish when line is red. Buy on first green, then sell on first red.
There is also an option to color the candles based on the RPO line.
开源脚本
秉承TradingView的精神,该脚本的作者将其开源,以便交易者可以查看和验证其功能。向作者致敬!您可以免费使用该脚本,但请记住,重新发布代码须遵守我们的网站规则。
-Profit Programmers
profitprogrammer.com
profitprogrammer.com
免责声明
这些信息和出版物并非旨在提供,也不构成TradingView提供或认可的任何形式的财务、投资、交易或其他类型的建议或推荐。请阅读使用条款了解更多信息。
开源脚本
秉承TradingView的精神,该脚本的作者将其开源,以便交易者可以查看和验证其功能。向作者致敬!您可以免费使用该脚本,但请记住,重新发布代码须遵守我们的网站规则。
-Profit Programmers
profitprogrammer.com
profitprogrammer.com
免责声明
这些信息和出版物并非旨在提供,也不构成TradingView提供或认可的任何形式的财务、投资、交易或其他类型的建议或推荐。请阅读使用条款了解更多信息。