PROTECTED SOURCE SCRIPT
已更新 Sigma-Level

1-Sigma-Level Indicator (for 28 FX Pairs)
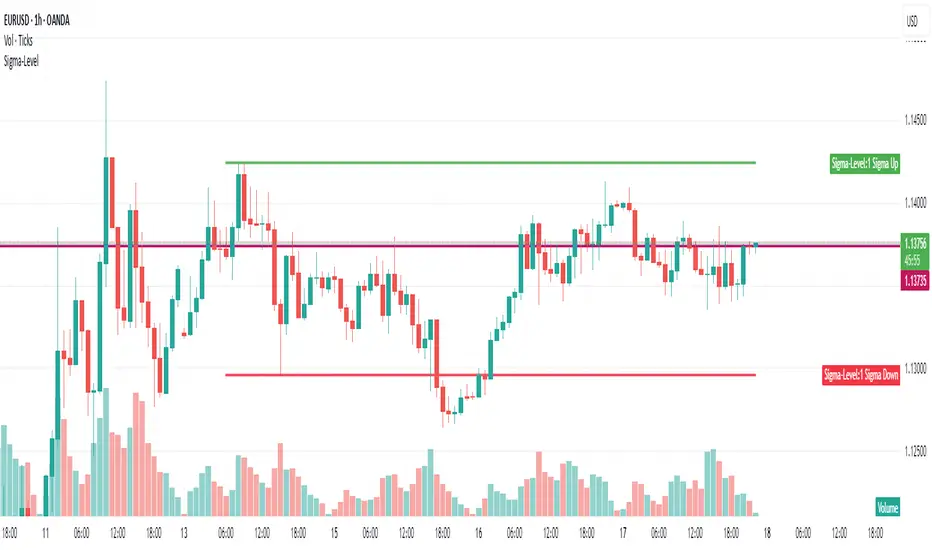
This TradingView indicator calculates and visualizes the 1-sigma price projection range for the current FX pair, based on implied volatility (IV) and a user-defined reference price.
🔧 User Inputs
1. Implied Volatility (IV) Selection
You can choose which volatility term to apply:
ON (Overnight)
1W (1 Week)
1M (1 Month)
Each currency pair uses manually entered IV values (in %), grouped by base currency (USD, EUR, GBP, etc.).
https://www.investing.com/currencies/forex-options
2. Base Price Selection
You can define the price level used as the anchor for the sigma projection:
CurrentPrice — live market price
YesterdayClose — close of the previous day
LastHourClose — close of the last 1-hour candle
LastFriday — weekly close from last Friday
LastMonthClose — close of the previous monthly candle
LastYearClose — close of the previous yearly candle
These values are retrieved using the appropriate timeframe (D, W, M, 12M, or 60 for hourly).
📐 How the Calculation Works
The indicator calculates the 1σ range using this formula:
1σ Range = basePrice × (IV / √N) / 100
Where:
basePrice is the selected anchor price.
IV is the selected implied volatility for the current pair.
N is the number of periods per year, depending on the IV term:
√252 for ON (trading days)
√52 for 1W (weeks)
√12 for 1M (months)
The upper and lower bands are then:
1σ Up = basePrice + range
1σ Down = basePrice - range
These bands are plotted only during the current calendar week.
🖼️ Visual Output
Green Line: 1σ Upper Boundary
Red Line: 1σ Lower Boundary
Labels show the exact 1σ values at the most recent bar
⚠️ Disclaimer
This indicator is for informational and analytical purposes only. It does not constitute financial advice, a trading signal, or a guarantee of future performance. Always perform your own research and consult with a qualified financial advisor before making trading decisions.
版本注释
Updaten Input to ON 1W and 1M版本注释
Fix Price Settings版本注释
Shrink to only ON受保护脚本
此脚本以闭源形式发布。 但是,您可以自由使用,没有任何限制 — 了解更多信息这里。
免责声明
这些信息和出版物并非旨在提供,也不构成TradingView提供或认可的任何形式的财务、投资、交易或其他类型的建议或推荐。请阅读使用条款了解更多信息。
受保护脚本
此脚本以闭源形式发布。 但是,您可以自由使用,没有任何限制 — 了解更多信息这里。
免责声明
这些信息和出版物并非旨在提供,也不构成TradingView提供或认可的任何形式的财务、投资、交易或其他类型的建议或推荐。请阅读使用条款了解更多信息。