OPEN-SOURCE SCRIPT
ATR with Donchian Channels and SMAs
This script combines the Average True Range (ATR), Donchian Channels, and Simple Moving Averages (SMAs) to provide a comprehensive tool for volatility and trend analysis.
Key Components:
ATR Calculation: The ATR is used to measure market volatility. It is calculated as a moving average of the true range over a specified length, which you can customize using different smoothing methods: RMA, SMA, EMA, or WMA. ATR helps identify periods of high and low volatility, giving insights into potential breakout or consolidation phases in the market.
Donchian Channels on ATR: The Donchian Channels are calculated based on the highest and lowest values of the ATR over a user-defined period. The upper and lower bands provide a volatility range, and the middle line represents the average of the two. This can help visualize the range of market volatility and detect possible trend reversals or continuations.
SMAs on ATR: Two Simple Moving Averages (SMA) are applied to the ATR values. These SMAs act as a smoothed version of the ATR, providing additional insight into volatility trends. By adjusting the length of these SMAs, you can track short-term and long-term volatility movements, helping in decision-making for potential entries and exits.
Inputs:
ATR Length: Set the length for calculating the ATR.
Smoothing Method: Choose from RMA, SMA, EMA, or WMA for smoothing the ATR calculation.
Donchian Channel Length: Set the length for calculating the highest and lowest ATR values for Donchian Channels.
SMA Lengths: Two adjustable lengths for applying SMAs to the ATR.
Visualization:
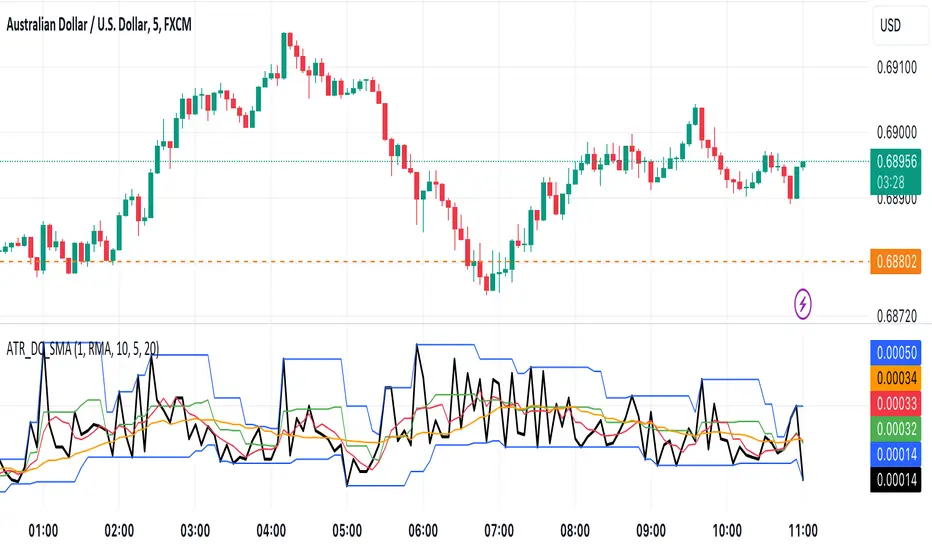
ATR Plot: The ATR is plotted in red, allowing you to see the market's volatility at a glance.
Donchian Channels: Blue lines represent the upper and lower bands, while the green line represents the middle line of the Donchian Channels, helping you visualize the volatility range.
SMAs: Two SMAs (green and orange) are plotted to smooth out the ATR and identify trends in volatility.
Use Cases:
Breakout Detection: High ATR values breaking out of the Donchian Channels may signal increased volatility and a potential breakout.
Trend Analysis: SMAs on ATR help smooth volatility trends, aiding in determining if the market is entering a more volatile or stable period.
Stop-Loss Placement: ATR and Donchian Channels can be used to set dynamic stop-loss levels based on market volatility.
This script is versatile and can be used across different asset classes, such as stocks, forex, crypto, and commodities. It is especially useful for traders who want to incorporate volatility into their trading strategies for better risk management and trend detection.
Key Components:
ATR Calculation: The ATR is used to measure market volatility. It is calculated as a moving average of the true range over a specified length, which you can customize using different smoothing methods: RMA, SMA, EMA, or WMA. ATR helps identify periods of high and low volatility, giving insights into potential breakout or consolidation phases in the market.
Donchian Channels on ATR: The Donchian Channels are calculated based on the highest and lowest values of the ATR over a user-defined period. The upper and lower bands provide a volatility range, and the middle line represents the average of the two. This can help visualize the range of market volatility and detect possible trend reversals or continuations.
SMAs on ATR: Two Simple Moving Averages (SMA) are applied to the ATR values. These SMAs act as a smoothed version of the ATR, providing additional insight into volatility trends. By adjusting the length of these SMAs, you can track short-term and long-term volatility movements, helping in decision-making for potential entries and exits.
Inputs:
ATR Length: Set the length for calculating the ATR.
Smoothing Method: Choose from RMA, SMA, EMA, or WMA for smoothing the ATR calculation.
Donchian Channel Length: Set the length for calculating the highest and lowest ATR values for Donchian Channels.
SMA Lengths: Two adjustable lengths for applying SMAs to the ATR.
Visualization:
ATR Plot: The ATR is plotted in red, allowing you to see the market's volatility at a glance.
Donchian Channels: Blue lines represent the upper and lower bands, while the green line represents the middle line of the Donchian Channels, helping you visualize the volatility range.
SMAs: Two SMAs (green and orange) are plotted to smooth out the ATR and identify trends in volatility.
Use Cases:
Breakout Detection: High ATR values breaking out of the Donchian Channels may signal increased volatility and a potential breakout.
Trend Analysis: SMAs on ATR help smooth volatility trends, aiding in determining if the market is entering a more volatile or stable period.
Stop-Loss Placement: ATR and Donchian Channels can be used to set dynamic stop-loss levels based on market volatility.
This script is versatile and can be used across different asset classes, such as stocks, forex, crypto, and commodities. It is especially useful for traders who want to incorporate volatility into their trading strategies for better risk management and trend detection.
开源脚本
秉承TradingView的精神,该脚本的作者将其开源,以便交易者可以查看和验证其功能。向作者致敬!您可以免费使用该脚本,但请记住,重新发布代码须遵守我们的网站规则。
免责声明
这些信息和出版物并非旨在提供,也不构成TradingView提供或认可的任何形式的财务、投资、交易或其他类型的建议或推荐。请阅读使用条款了解更多信息。
开源脚本
秉承TradingView的精神,该脚本的作者将其开源,以便交易者可以查看和验证其功能。向作者致敬!您可以免费使用该脚本,但请记住,重新发布代码须遵守我们的网站规则。
免责声明
这些信息和出版物并非旨在提供,也不构成TradingView提供或认可的任何形式的财务、投资、交易或其他类型的建议或推荐。请阅读使用条款了解更多信息。