OPEN-SOURCE SCRIPT
已更新 liquidity volume

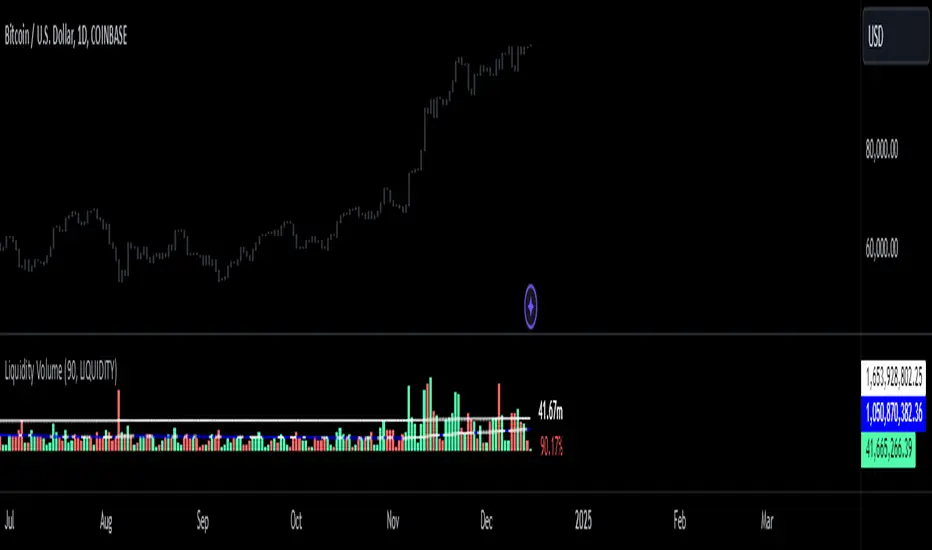
just like volume, this indicator shows how much in dollars were traded in millions.
版本注释
made the volume bars represent colors based on bearish or bullish movement版本注释
added a mean (average) to the script. 版本注释
added a 3rd standard deviation to the indicator. a 3sd occurrence has a 0.2% chance of occurrence on a statistical standpoint. but when it comes to markets it happens more often. nonetheless, a 3sd alert can signify a major market movement due to increase of activity of dollars going in or out of that asset you are observing. P.S.A. go on settings, under style tab, change the "price line" to a histogram. 版本注释
changed the plotted liqudity to a column 版本注释
when the line is purple that means that liquidity is going down. when the line is white that means liquidity is going up 版本注释
ive made improvements on the script. easier to use and read版本注释
made a little bit more modification版本注释
you can switch from representation of liquidity and equity. equity is just normal volume版本注释
we have added a new stat. you can see how much volume has increased/decreased from the previous bar in percentage版本注释
modified the separation of labels so no overlapping occurs版本注释
开源脚本
秉承TradingView的精神,该脚本的作者将其开源,以便交易者可以查看和验证其功能。向作者致敬!您可以免费使用该脚本,但请记住,重新发布代码须遵守我们的网站规则。
免责声明
这些信息和出版物并非旨在提供,也不构成TradingView提供或认可的任何形式的财务、投资、交易或其他类型的建议或推荐。请阅读使用条款了解更多信息。
开源脚本
秉承TradingView的精神,该脚本的作者将其开源,以便交易者可以查看和验证其功能。向作者致敬!您可以免费使用该脚本,但请记住,重新发布代码须遵守我们的网站规则。
免责声明
这些信息和出版物并非旨在提供,也不构成TradingView提供或认可的任何形式的财务、投资、交易或其他类型的建议或推荐。请阅读使用条款了解更多信息。