OPEN-SOURCE SCRIPT
已更新 Linear Regression Forecast Tool [Daveatt]
Hello traders,
Navigating through the financial markets requires a blend of analysis, insight, and a touch of foresight.
My Linear Regression Forecast Tool is here to add that touch of foresight to your analysis toolkit on TradingView!
Linear Regression is the heart of this tool, a statistical method that explores the relationship between a dependent variable and one (or more) independent variable(s).
In simpler terms, it finds a straight line that best fits a set of data points.
This "line of best fit" then becomes a visual representation of the relationship in the data, providing a basis for making predictions.
Here's what the Linear Regression Forecast Tool brings to your trading table:
Multiple Indicator Choices: Select from various market indicators like Simple Moving Averages, Bollinger Bands, or the Volume Weighted Average Price as the basis for your linear regression analysis.
Customizable Forecast Periods: Define how many periods ahead you want to forecast, adjusting to your analysis needs, whether that's looking 5, 7, or 10 periods into the future.
On-Chart Forecast Points: The tool plots the forecasted points on your chart, providing a straightforward visual representation of potential future values based on past data.
In this script:
1. We first calculate the indicator using the specified period.
2. We then use the ta.linreg function to calculate a linear regression curve fitted to the indicator over the last Period bars.
3. We calculate the slope of the linear regression curve using the last two points on the curve.
We use this slope to extrapolate the linear regression curve to forecast the next X points of the indicator.
4/ Finally, we use the plot function to plot the original indicator and the forecasted points on the chart, using the offset parameter to shift the forecasted points to the right (into the future).
This method assumes that the trend represented by the linear regression curve will continue, which may not always be the case, especially in volatile or changing market conditions.
Examples:
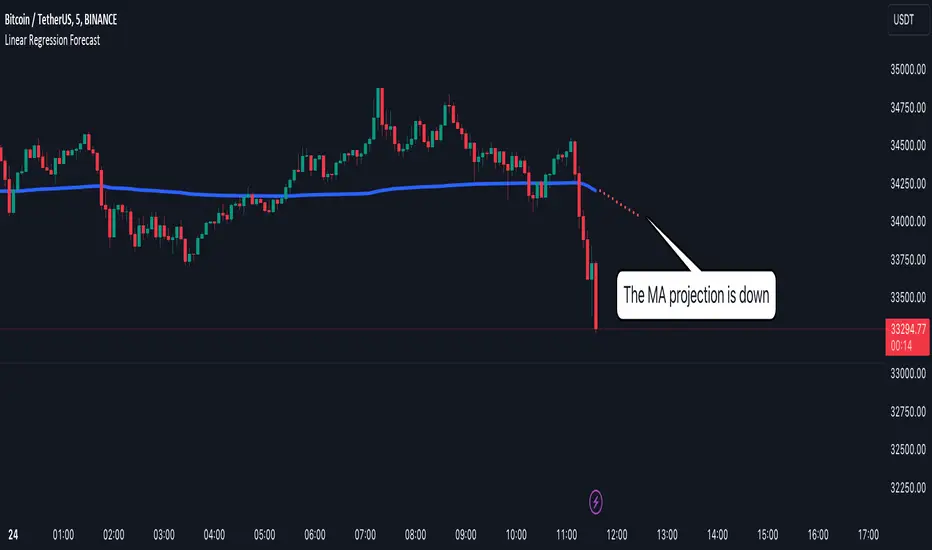
Works with a moving average

Works with a Bollinger band

The code can be adapted to work with any other indicator (imagine RSI, MACD, other Moving Average Type, PSAR, Supertrend, etc...)
Conclusion
The Linear Regression Forecast Tool doesn't promise to tell the future but provides a structured way to visualize possible future price trends based on historical data. I
Remember, no tool can predict market conditions with certainty.
It's always advisable to corroborate findings with other analysis methods and stay updated with market news and events.
Happy trading!
Navigating through the financial markets requires a blend of analysis, insight, and a touch of foresight.
My Linear Regression Forecast Tool is here to add that touch of foresight to your analysis toolkit on TradingView!
Linear Regression is the heart of this tool, a statistical method that explores the relationship between a dependent variable and one (or more) independent variable(s).
In simpler terms, it finds a straight line that best fits a set of data points.
This "line of best fit" then becomes a visual representation of the relationship in the data, providing a basis for making predictions.
Here's what the Linear Regression Forecast Tool brings to your trading table:
Multiple Indicator Choices: Select from various market indicators like Simple Moving Averages, Bollinger Bands, or the Volume Weighted Average Price as the basis for your linear regression analysis.
Customizable Forecast Periods: Define how many periods ahead you want to forecast, adjusting to your analysis needs, whether that's looking 5, 7, or 10 periods into the future.
On-Chart Forecast Points: The tool plots the forecasted points on your chart, providing a straightforward visual representation of potential future values based on past data.
In this script:
1. We first calculate the indicator using the specified period.
2. We then use the ta.linreg function to calculate a linear regression curve fitted to the indicator over the last Period bars.
3. We calculate the slope of the linear regression curve using the last two points on the curve.
We use this slope to extrapolate the linear regression curve to forecast the next X points of the indicator.
4/ Finally, we use the plot function to plot the original indicator and the forecasted points on the chart, using the offset parameter to shift the forecasted points to the right (into the future).
This method assumes that the trend represented by the linear regression curve will continue, which may not always be the case, especially in volatile or changing market conditions.
Examples:
Works with a moving average
Works with a Bollinger band
The code can be adapted to work with any other indicator (imagine RSI, MACD, other Moving Average Type, PSAR, Supertrend, etc...)
Conclusion
The Linear Regression Forecast Tool doesn't promise to tell the future but provides a structured way to visualize possible future price trends based on historical data. I
Remember, no tool can predict market conditions with certainty.
It's always advisable to corroborate findings with other analysis methods and stay updated with market news and events.
Happy trading!
版本注释
Updating the chart from this post开源脚本
秉承TradingView的精神,该脚本的作者将其开源,以便交易者可以查看和验证其功能。向作者致敬!您可以免费使用该脚本,但请记住,重新发布代码须遵守我们的网站规则。
⭐️ I'm looking to sell Best Trading Indicator. DM me if interested
⭐️ Listed as an Official TradingView Trusted TOP Pine Programmer
📧 Coding/Consulting Inquiries: dave@best-trading-indicator.com
⏩ Course: best-trading-indicator.com
⭐️ Listed as an Official TradingView Trusted TOP Pine Programmer
📧 Coding/Consulting Inquiries: dave@best-trading-indicator.com
⏩ Course: best-trading-indicator.com
免责声明
这些信息和出版物并非旨在提供,也不构成TradingView提供或认可的任何形式的财务、投资、交易或其他类型的建议或推荐。请阅读使用条款了解更多信息。
开源脚本
秉承TradingView的精神,该脚本的作者将其开源,以便交易者可以查看和验证其功能。向作者致敬!您可以免费使用该脚本,但请记住,重新发布代码须遵守我们的网站规则。
⭐️ I'm looking to sell Best Trading Indicator. DM me if interested
⭐️ Listed as an Official TradingView Trusted TOP Pine Programmer
📧 Coding/Consulting Inquiries: dave@best-trading-indicator.com
⏩ Course: best-trading-indicator.com
⭐️ Listed as an Official TradingView Trusted TOP Pine Programmer
📧 Coding/Consulting Inquiries: dave@best-trading-indicator.com
⏩ Course: best-trading-indicator.com
免责声明
这些信息和出版物并非旨在提供,也不构成TradingView提供或认可的任何形式的财务、投资、交易或其他类型的建议或推荐。请阅读使用条款了解更多信息。