OPEN-SOURCE SCRIPT
已更新 Average Range Targets
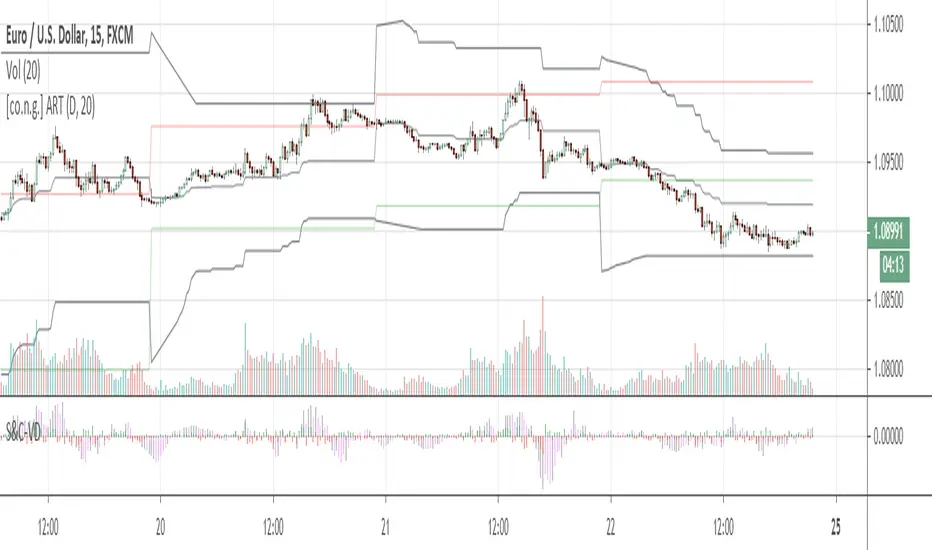
This super simple script helps spotting possible turnarounds and targets on intraday level.
The average daily range is calculated over a period of 20 days, which is approximately a trading month.
The black lines indicate the upper and lower range targets, moving closer with each new intrady high and low.
As you might recognize, in most cases the price is about to turn when one range target is hit.
The red and green lines are showing previous day's high and low as referneces.
Enjoy!
Warm regards,
Constantine Trading
版本注释
Slimmed the script and sped up calculations, fixed plotting errors.1st:
I've added a midrange level. Usually, if price is below midrange, action is suppoes to be short;
if price is above otherwise.
2nd:
Most of the time price bounces once from range target level. If it reaches a second time, chances of breaking through are high.
HINT!
Don't rely solely on this script always watch out for a proper price action setup! Consider trend direction!
开源脚本
秉承TradingView的精神,该脚本的作者将其开源,以便交易者可以查看和验证其功能。向作者致敬!您可以免费使用该脚本,但请记住,重新发布代码须遵守我们的网站规则。
免责声明
这些信息和出版物并非旨在提供,也不构成TradingView提供或认可的任何形式的财务、投资、交易或其他类型的建议或推荐。请阅读使用条款了解更多信息。
开源脚本
秉承TradingView的精神,该脚本的作者将其开源,以便交易者可以查看和验证其功能。向作者致敬!您可以免费使用该脚本,但请记住,重新发布代码须遵守我们的网站规则。
免责声明
这些信息和出版物并非旨在提供,也不构成TradingView提供或认可的任何形式的财务、投资、交易或其他类型的建议或推荐。请阅读使用条款了解更多信息。