INVITE-ONLY SCRIPT
已更新 FrogOracle Support Resistance Levels
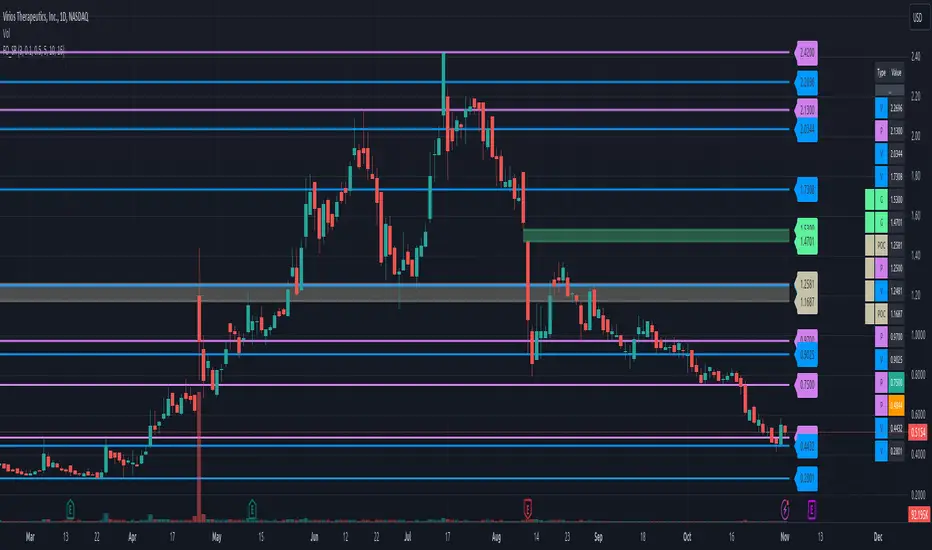
This indicator displays support and resistance levels generated by the FrogOracle trading tool.
These levels are represented by the lines on the chart as well as a level table which also highlights the nearest level above and below the current price.
⚪ Types of Lines ⚪
There are several types of levels represented on the chart. These can be toggled on and off individually in the settings.
🔶 USAGE 🔶
Using the indicator is easy, just load it up and you will start seeing s/r lines if we have the ticker in our dataset. The options are full of ways to tune the tool to your specific needs. Take some time and look through them and see the full documentation here: frogoracletrading.com/documentation
🔷 ACCESS 🔷
To gain access to this indicator please visit the website below. Once you have joined and provided your TV username you will be able to add the indicator to your chart.
frogoracletrading.com/
These levels are represented by the lines on the chart as well as a level table which also highlights the nearest level above and below the current price.
⚪ Types of Lines ⚪
There are several types of levels represented on the chart. These can be toggled on and off individually in the settings.
- Price Derived S/R ( P ): These lines are derived from pivot points in the raw price data run through the S/R algorithm.
- Volume Derived S/R ( V ): These lines are derived by using intra-day volume to identify points of control. These daily areas of increased activity are then used to identify critical levels over the requested timeframe.
- Point of Control ( POC ): This range represents where the majority of intra-day volume occurred over the requested timeframe.
- Developing Point of Control ( DPOC ): This level is derived from the last 1+ days of volume data in realtime and shows where the most shares have been traded.
- Gap ( G ): These ranges show areas of gaps in the price action which often act as magnets. Gaps like to be closed.
- Psychological ( M ): Disabled By Default. These levels are typically nice round increments that traders flock to. As such they often act as areas of support and resistance.
- Previous Day ( PD ): Displays the previous days High, Low and Close on the chart and table.
- Pre-Market ( PM ): Displays the pre-market High, Low and Close on the chart and table.
🔶 USAGE 🔶
Using the indicator is easy, just load it up and you will start seeing s/r lines if we have the ticker in our dataset. The options are full of ways to tune the tool to your specific needs. Take some time and look through them and see the full documentation here: frogoracletrading.com/documentation
🔷 ACCESS 🔷
To gain access to this indicator please visit the website below. Once you have joined and provided your TV username you will be able to add the indicator to your chart.
frogoracletrading.com/
版本注释
- Fixed physiological levels extending below 0.0
版本注释
- Fixed POC and Gap line labels still showing up when the lines are disabled.
版本注释
- Increased the number of lines the indicator can show. This fixes the bug where some lines were not being displayed when all types of lines were enabled.
版本注释
Breaking Change Update Required
- Updated encoding / decoding scheme to allow for tickers with larger prices to be handled properly. This is to support certain Crypto Currencies like BTC.
版本注释
- Reworked the data loading code to fix problem with levels from longer analysis periods missing from the chart.
版本注释
- Added options to include previous days high, low, close as levels
- Added option to display filling in the ranges for POC and Gap types
版本注释
This is a first pass at simplifying some of the configuration and UI. - Added individual toggles for each type of line
- The table and chart will now display the same data to make configuration easier
- Reduced the default opacity of filled in ranges
- Show analysis periods in labels by default
- Previous Day Levels will now show "H" "L" "C" in the label to indicate if the line is from the high low or close
版本注释
More Lines More Lines Never Enough Lines- Fixed previous day high low close
- Added an option to display premarket high / low and current day open
- Added ability to show notes in level labels
- Added option to display a range (fuzz) around each level based on a % of ATR
版本注释
- Fixed levels not loading if mental / PD levels were disabled
版本注释
- New website with better documentation and examples.
- Initial support for settings templates. Choose between custom, small cap and large cap
- Built in color themes or fully custom
- More control over exactly which lines are displayed
- New UI for displaying a range around lines to help remind you the levels should be treated as ranges not absolute values.
- Ranges now autoscale better based on an average of ADR
- Settings rearranged and simplified
- Updated core internal data structures to improve performance and reduce memory usage.
版本注释
- Fixed the ranges sometimes getting overlapped from old ones not being removed.
- Fixed another memory leak that could cause the indicator to stop working after an extended period of time.
版本注释
- Added version number to help users understand if they have the latest version. First version will be 1.0.0
版本注释
- Fixed bug that could cause the script not to load when the table wasn't properly sized.
版本注释
- Added layout presets to help when switching from mobile to desktop.
版本注释
- Fixed table not loading if price is above all levels.
版本注释
- Added tooltips to the level labels which contain extra information.
- Version updated to 1.1.0
版本注释
- Added faint ghost lines which show the original levels when merging is enabled. Defaults to off.
- Version updated to 1.2.0
版本注释
- Added support for futures contracts
- Added new line type, Developing POC which is the volume point of control built from real time data.
- Added another mental level price bucket to handle tickers like BTCUSD which are well over 1K
- Moved version property to text by logo instead of settings property.
- Fixed period length labels not being cleaned up
- Large restructuring of the code to provide more stable base for future development.
版本注释
- Fixed bug where not all levels would be retained when merging more than two levels into one.
版本注释
- Replaced 60 day analysis period with 5 day to capture more short term levels which were sometimes missing from the current periods.
版本注释
- Reworked settings to bring level merging to its own section.
- A minimal merge is now enabled by default to reduce near duplicates
- Version updated to 1.3.3
版本注释
This is a major release focusing mostly on behind the scene performance optimizations.- Overall CPU utilization decreased by > 50%
- Initial load times sped up
- POC ranges can now merge with other POC levels to help keep the chart cleaner
- Fixed a bug where extra "Ghost" levels would be charted when merging is enabled
- Merged lines will now show all the periods from merged lines in the label
版本注释
- Fixed Previous Day Levels being incorrect until the first bar closes.
版本注释
- Fixed bug where indicator would crash if the table was disabled.
版本注释
- Psychological levels can now be merged along with Price and Volume levels.
- Fixed show boxes around levels not working properly on Monday and Tuesdays
- Version updated to 2.1.0
版本注释
- Fixed error when trying to add to chart seemingly due to some backend pinescript language change.
版本注释
- Updated crypto logic to share levels for the base currencies across futures and usdt vs usd versions of the currencies.
版本注释
Version: 2.1.4- Added label color option in settings.
仅限邀请脚本
只有作者授权的用户才能访问此脚本。您需要申请并获得使用许可。通常情况下,付款后即可获得许可。更多详情,请按照下方作者的说明操作,或直接联系The_Trading_Frog。
请注意,此私密、仅限邀请脚本未经脚本版主审核,是否符合网站规则尚未确定。 TradingView不建议您付费购买或使用任何脚本,除非您完全信任其作者并了解其工作原理。您也可以在我们的社区脚本找到免费的开源替代方案。
作者的说明
To gain access to this indicator please visit the website. https://www.frogoracletrading.com/
On the site click "Get the Indicator" and follow the steps to get up and running!
免责声明
这些信息和出版物并非旨在提供,也不构成TradingView提供或认可的任何形式的财务、投资、交易或其他类型的建议或推荐。请阅读使用条款了解更多信息。