OPEN-SOURCE SCRIPT
Back to the Future
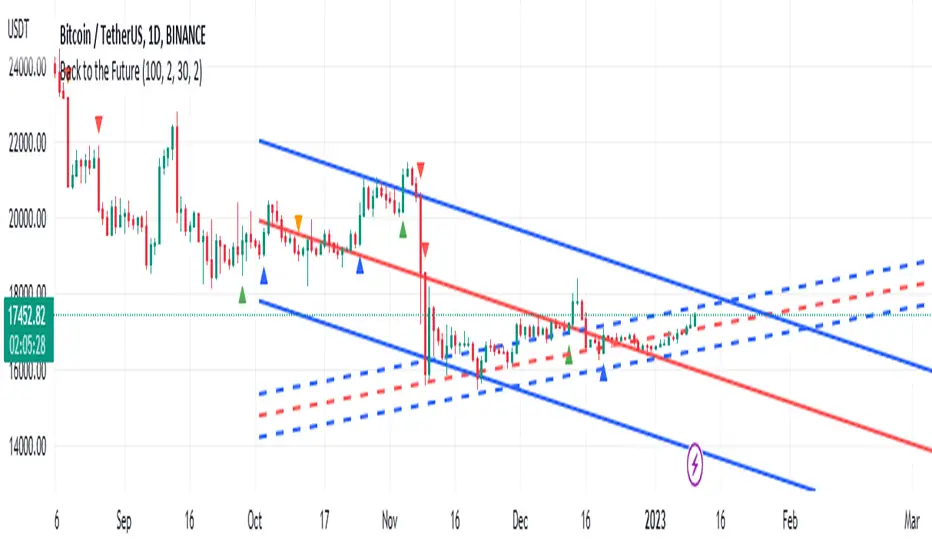
Hallo, very simple indicator in order to view trends
we have two linear regressions
one is the regular one that we know at length 100
the other one is lagging or past linear which is shorter at length 30
the basic idea is that when we combine both we can see trend of the current and the past linear when they cross each other and from this we can make signals.
Assuming that past shorter trend has the value of resistance or threshold values, so cross of current linear of those points can show if the trend is to buy or to sell by signals seen in the arrows .
So past and present mix and give us the future.
need to solve issue when market goes sideways but it easy to see how the trend look by the signals .
past linear seen in concave lines the current is the other one.
signals of positive trends are arrow up green or blue. negative trend red or orange arrow down
开源脚本
秉承TradingView的精神,该脚本的作者将其开源,以便交易者可以查看和验证其功能。向作者致敬!您可以免费使用该脚本,但请记住,重新发布代码须遵守我们的网站规则。
免责声明
这些信息和出版物并非旨在提供,也不构成TradingView提供或认可的任何形式的财务、投资、交易或其他类型的建议或推荐。请阅读使用条款了解更多信息。
开源脚本
秉承TradingView的精神,该脚本的作者将其开源,以便交易者可以查看和验证其功能。向作者致敬!您可以免费使用该脚本,但请记住,重新发布代码须遵守我们的网站规则。
免责声明
这些信息和出版物并非旨在提供,也不构成TradingView提供或认可的任何形式的财务、投资、交易或其他类型的建议或推荐。请阅读使用条款了解更多信息。