OPEN-SOURCE SCRIPT
Volume Distribution Deviation
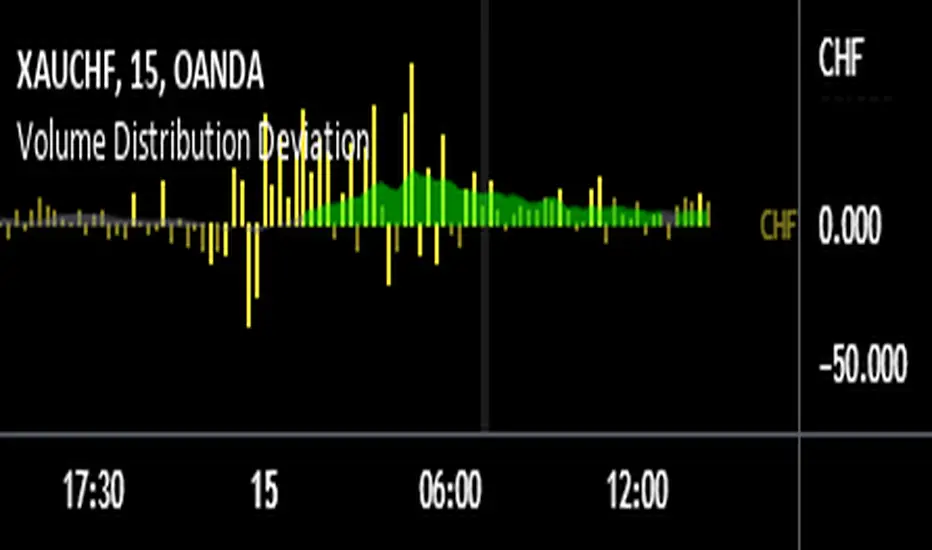
This indicator explores the question - "Does a currency's PERCENTAGE of trading volume verses other currencies show an insight into market sentiment?"
Specifically, it calculates the average market share based on the same time of day for a given number of days back (10 days by default) for trades involving the selected currency then presents fluctuations from that average as a percentage.
For example, assume that currencies involving EUR (EURUSD, EURAUD, EURCAD etc…) on average account for 20% of trading volume at 8am GMT (London open) however today at London open EUR crosses account for 30% at London open – 50% higher than usual. Does this information give us a heads up for market sentiment for the next few hours? And what if EUR volume was 50% higher than average and USD was 30% lower than average – should we focus on EUR and pass on USD that session?
Note that the indicator is not presenting information regarding volume quantity – it is showing you interest in that currency within the volume occurring that day. I already have an indicator that compares volume quantity to average volume quantity for that time of day, this takes the concept a little further and shows the normalised deviations from that average. So if USD volume was up 50% and NZD was up 50% they will show as equal on the indicator even though the actual traded volume of USD is probably x10 higher.
I find the 15 minute timeframe gives the most meaningful data. I use an 8 window chart and display the deviations for each currency (NZD, AUD, JPY, CHF, EUR, GBP, CAD, USD). If you set to 'Automatic' the indicator will automatically chose the currency based on the currency you crossed with gold (OANDA:XAUNZD, OANDA:XAUAUD, OANDA:XAUJPY, OANDA:XAUCHF, OANDA:XAUEUR, OANDA:XAUGBP, OANDA:XAUCAD, OANDA:XAUUSD). I tend to look at the average deviation rather than an isolated spike.
There are features in the indicator to try to summarise and highlight impactful data - highlighted deviations over a set tolerance (10% by default) and the SMA of the deviations.
Good luck
开源脚本
秉承TradingView的精神,该脚本的作者将其开源,以便交易者可以查看和验证其功能。向作者致敬!您可以免费使用该脚本,但请记住,重新发布代码须遵守我们的网站规则。
免责声明
这些信息和出版物并非旨在提供,也不构成TradingView提供或认可的任何形式的财务、投资、交易或其他类型的建议或推荐。请阅读使用条款了解更多信息。
开源脚本
秉承TradingView的精神,该脚本的作者将其开源,以便交易者可以查看和验证其功能。向作者致敬!您可以免费使用该脚本,但请记住,重新发布代码须遵守我们的网站规则。
免责声明
这些信息和出版物并非旨在提供,也不构成TradingView提供或认可的任何形式的财务、投资、交易或其他类型的建议或推荐。请阅读使用条款了解更多信息。