INVITE-ONLY SCRIPT
已更新 Supply & Demand (OTC)
Supply & Demand - Advanced Zone Detection
Overview
This indicator is a sophisticated tool designed to automatically identify and draw high-probability supply and demand zones on your chart. It analyzes pure price action to find key areas where institutional buying and selling pressure has previously occurred, providing you with a clear map of potential market turning points.
Unlike basic supply and demand indicators, this script is built with a proprietary engine that intelligently defines zone boundaries and filters for the most relevant price action patterns. It's designed to be a clean, professional, and highly customizable tool for traders who use supply and demand as a core part of their strategy.
Features
Advanced Zone Detection: Automatically finds and draws supply and demand zones based on significant price imbalances.
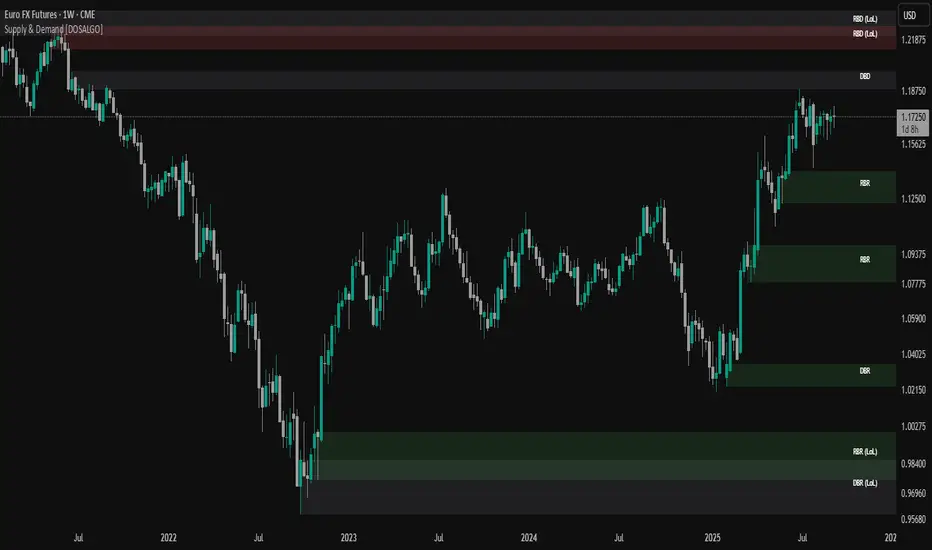
Reversal & Continuation Patterns: Identifies all four major price action patterns: Rally-Base-Drop (RBD), Drop-Base-Rally (DBR), Rally-Base-Rally (RBR), and Drop-Base-Drop (DBD).
"Level on Level" (LoL) Analysis: Automatically detects and labels zones that are stacked closely together, highlighting areas of potentially high liquidity and significance.
Wider vs. Preferred Zones: Choose between two zone definition modes. "Wider" mode draws the zone based on the full range of the consolidation, while "Preferred" mode refines the entry line based on key price action within the base, offering more precision.
Smart Zone Display: Intelligently displays only the most relevant zones closest to the current price, keeping your chart clean and focused. Supply zones above the current price and demand zones below are automatically prioritized and displayed based on your settings.
Customizable Zone Interaction: Control how zones react after being tested. Zones can change color on a first touch and be automatically deleted after a significant violation, which you can define by a percentage.
Customizable Visuals & Alerts: Fully customize the colors of all zones and candles. Enable or disable alerts for new zone creation and zone touches to stay on top of market movements.
How to Use
Identify Zones: The indicator will automatically plot supply zones (red) above the price and demand zones (green) below the price. These are potential areas to look for trade entries.
Assess Zone Strength: The strongest zones are typically "fresh" (untouched) and are formed by a strong, explosive move away from a tight consolidation (a small number of base candles).
Use Labels for Context: The floating labels (RBD, DBR, RBR (LoL), etc.) provide immediate context about the price action structure that formed each zone. "LoL" indicates a "Level on Level" zone, which may be of higher importance.
Wait for Confirmation: For the highest probability setups, wait for the price to return to a zone and show signs of rejection (e.g., reversal candlestick patterns) before considering an entry.
Settings Overview
Zone Definition: Control the core logic, such as including continuation patterns, setting the max number of base candles, and choosing between Wider and Preferred zone types.
Zone Display & Limits: Toggle limits on or off, and specify the maximum number of supply and demand zones to show on the chart.
Zone Interaction: Define how zones react to being tested, including the percentage required to delete a zone.
Colors & Style: Fully customize the appearance of zones, labels, and price candles.
Alerts: Enable or disable alerts for key events.
Disclaimer
This indicator is a tool for market analysis and should not be considered financial advice or a signal provider. Always use proper risk management and conduct your own analysis before making any trading decisions. Past performance is not indicative of future results.
Overview
This indicator is a sophisticated tool designed to automatically identify and draw high-probability supply and demand zones on your chart. It analyzes pure price action to find key areas where institutional buying and selling pressure has previously occurred, providing you with a clear map of potential market turning points.
Unlike basic supply and demand indicators, this script is built with a proprietary engine that intelligently defines zone boundaries and filters for the most relevant price action patterns. It's designed to be a clean, professional, and highly customizable tool for traders who use supply and demand as a core part of their strategy.
Features
Advanced Zone Detection: Automatically finds and draws supply and demand zones based on significant price imbalances.
Reversal & Continuation Patterns: Identifies all four major price action patterns: Rally-Base-Drop (RBD), Drop-Base-Rally (DBR), Rally-Base-Rally (RBR), and Drop-Base-Drop (DBD).
"Level on Level" (LoL) Analysis: Automatically detects and labels zones that are stacked closely together, highlighting areas of potentially high liquidity and significance.
Wider vs. Preferred Zones: Choose between two zone definition modes. "Wider" mode draws the zone based on the full range of the consolidation, while "Preferred" mode refines the entry line based on key price action within the base, offering more precision.
Smart Zone Display: Intelligently displays only the most relevant zones closest to the current price, keeping your chart clean and focused. Supply zones above the current price and demand zones below are automatically prioritized and displayed based on your settings.
Customizable Zone Interaction: Control how zones react after being tested. Zones can change color on a first touch and be automatically deleted after a significant violation, which you can define by a percentage.
Customizable Visuals & Alerts: Fully customize the colors of all zones and candles. Enable or disable alerts for new zone creation and zone touches to stay on top of market movements.
How to Use
Identify Zones: The indicator will automatically plot supply zones (red) above the price and demand zones (green) below the price. These are potential areas to look for trade entries.
Assess Zone Strength: The strongest zones are typically "fresh" (untouched) and are formed by a strong, explosive move away from a tight consolidation (a small number of base candles).
Use Labels for Context: The floating labels (RBD, DBR, RBR (LoL), etc.) provide immediate context about the price action structure that formed each zone. "LoL" indicates a "Level on Level" zone, which may be of higher importance.
Wait for Confirmation: For the highest probability setups, wait for the price to return to a zone and show signs of rejection (e.g., reversal candlestick patterns) before considering an entry.
Settings Overview
Zone Definition: Control the core logic, such as including continuation patterns, setting the max number of base candles, and choosing between Wider and Preferred zone types.
Zone Display & Limits: Toggle limits on or off, and specify the maximum number of supply and demand zones to show on the chart.
Zone Interaction: Define how zones react to being tested, including the percentage required to delete a zone.
Colors & Style: Fully customize the appearance of zones, labels, and price candles.
Alerts: Enable or disable alerts for key events.
Disclaimer
This indicator is a tool for market analysis and should not be considered financial advice or a signal provider. Always use proper risk management and conduct your own analysis before making any trading decisions. Past performance is not indicative of future results.
版本注释
Updated the zone live logic版本注释
updated the default settings版本注释
Fixed a bug and simplified the settings.版本注释
Updated the authors instructions仅限邀请脚本
只有作者授权的用户才能访问此脚本。您需要申请并获得使用许可。通常情况下,付款后即可获得许可。更多详情,请按照下方作者的说明操作,或直接联系DOSALGO。
TradingView不建议您付费购买或使用任何脚本,除非您完全信任其作者并了解其工作原理。您也可以在我们的社区脚本找到免费的开源替代方案。
作者的说明
Unlock all exclusive indicators only at: 🌐 https://dosalgo.com/
Join our community: discord.gg/QnF9V62JWu
免责声明
这些信息和出版物并非旨在提供,也不构成TradingView提供或认可的任何形式的财务、投资、交易或其他类型的建议或推荐。请阅读使用条款了解更多信息。
仅限邀请脚本
只有作者授权的用户才能访问此脚本。您需要申请并获得使用许可。通常情况下,付款后即可获得许可。更多详情,请按照下方作者的说明操作,或直接联系DOSALGO。
TradingView不建议您付费购买或使用任何脚本,除非您完全信任其作者并了解其工作原理。您也可以在我们的社区脚本找到免费的开源替代方案。
作者的说明
Unlock all exclusive indicators only at: 🌐 https://dosalgo.com/
Join our community: discord.gg/QnF9V62JWu
免责声明
这些信息和出版物并非旨在提供,也不构成TradingView提供或认可的任何形式的财务、投资、交易或其他类型的建议或推荐。请阅读使用条款了解更多信息。