OPEN-SOURCE SCRIPT
Rolling Correlation with Bitcoin V1.1 [ADRIDEM]
Overview
The Rolling Correlation with Bitcoin script is designed to offer a comprehensive view of the correlation between the selected ticker and Bitcoin. This script helps investors understand the relationship between the performance of the current ticker and Bitcoin over a rolling period, providing insights into their interconnected behavior. Below is a detailed presentation of the script and its unique features.
Unique Features of the New Script
Originality and Usefulness
This script uniquely combines the analysis of rolling correlation for a current ticker with Bitcoin, providing a comparative view of their relationship. The inclusion of a customizable rolling window and smoothing option enhances its adaptability and usefulness in various market conditions.
Signal Description
The script includes several features that highlight potential insights into the correlation between the assets:
These features assist in identifying the strength and direction of the relationship between the current ticker and Bitcoin.
Detailed Description
Input Variables
Functionality
Correlation Calculation : The script calculates the daily returns for both Bitcoin and the current ticker and computes their rolling correlation coefficient.
```pine
bitcoin_close = request.security(bitcoin_ticker, timeframe.period, close)
bitcoin_dailyReturn = ta.change(bitcoin_close) / bitcoin_close[1]
current_dailyReturn = ta.change(close) / close[1]
rolling_correlation = ta.correlation(current_dailyReturn, bitcoin_dailyReturn, length)
```
Smoothing : A simple moving average is applied to the rolling correlation coefficient to smooth the data.
```pine
smoothed_correlation = ta.sma(rolling_correlation, smoothing_length)
```
Plotting : The script plots the smoothed rolling correlation coefficient and includes horizontal lines for key levels.
```pine
plot(smoothed_correlation, title="Rolling Correlation with Bitcoin", color=color.rgb(255, 82, 82, 50), linewidth=2)
h_neg1 = hline(-1, "-1 Line", color=color.gray)
h_neg05 = hline(-0.5, "-0.5 Line", color=color.red)
h0 = hline(0, "Zero Line", color=color.gray)
h_pos05 = hline(0.5, "0.5 Line", color=color.green)
h1 = hline(1, "1 Line", color=color.gray)
fill(h_neg1, h_neg05, color=color.rgb(255, 0, 0, 90), title="Strong Negative Correlation Background")
fill(h_neg05, h0, color=color.rgb(255, 165, 0, 90), title="Weak Negative Correlation Background")
fill(h0, h_pos05, color=color.rgb(255, 255, 0, 90), title="Weak Positive Correlation Background")
fill(h_pos05, h1, color=color.rgb(0, 255, 0, 90), title="Strong Positive Correlation Background")
```
How to Use
This script provides a detailed comparative view of the correlation between the current ticker and Bitcoin, aiding in more informed decision-making by highlighting the strength and direction of their relationship.
The Rolling Correlation with Bitcoin script is designed to offer a comprehensive view of the correlation between the selected ticker and Bitcoin. This script helps investors understand the relationship between the performance of the current ticker and Bitcoin over a rolling period, providing insights into their interconnected behavior. Below is a detailed presentation of the script and its unique features.
Unique Features of the New Script
- Bitcoin Comparison : Allows users to compare the correlation of the current ticker with Bitcoin, providing an analysis of their relationship.
- Customizable Rolling Window : Enables users to set the length for the rolling window, adapting to different market conditions and timeframes. The default value is 252 bars, which approximates one year of trading days, but it can be adjusted as needed.
- Smoothing Option : Includes an option to apply a smoothing simple moving average (SMA) to the correlation coefficient, helping to reduce noise and highlight trends. The smoothing length is customizable, with a default value of 4 bars.
- Visual Indicators : Plots the smoothed correlation coefficient between the current ticker and Bitcoin, with distinct colors for easy interpretation. Additionally, horizontal lines help identify key levels of correlation.
- Dynamic Background Color : Adds dynamic background colors to highlight areas of strong positive and negative correlations, enhancing visual clarity.
Originality and Usefulness
This script uniquely combines the analysis of rolling correlation for a current ticker with Bitcoin, providing a comparative view of their relationship. The inclusion of a customizable rolling window and smoothing option enhances its adaptability and usefulness in various market conditions.
Signal Description
The script includes several features that highlight potential insights into the correlation between the assets:
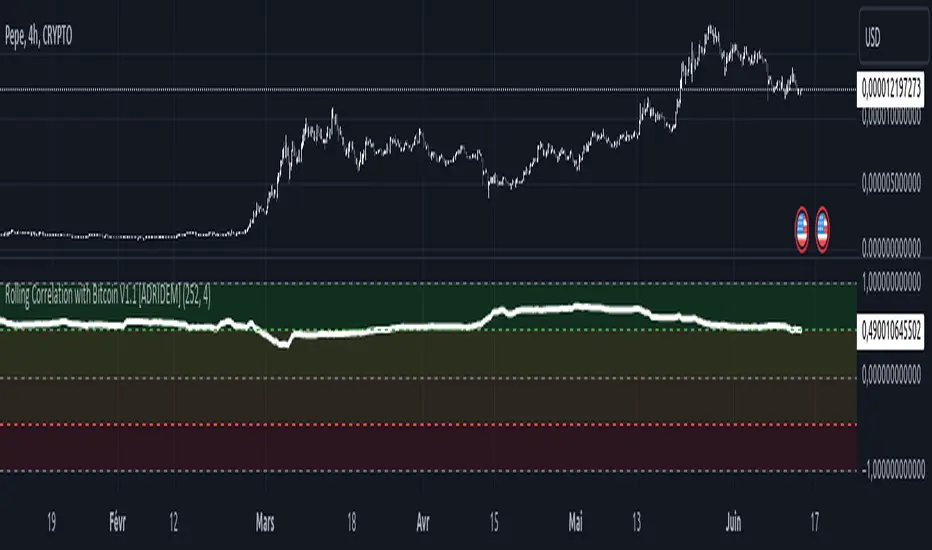
- Rolling Correlation with Bitcoin : Plotted as a red line, this represents the smoothed rolling correlation coefficient between the current ticker and Bitcoin.
- Horizontal Lines and Background Color : Lines at -0.5, 0, and 0.5 help to quickly identify regions of strong negative, weak, and strong positive correlations.
These features assist in identifying the strength and direction of the relationship between the current ticker and Bitcoin.
Detailed Description
Input Variables
- Length for Rolling Window (`length`) : Defines the range for calculating the rolling correlation coefficient. Default is 252.
- Smoothing Length (`smoothing_length`) : The number of periods for the smoothing SMA. Default is 4.
- Bitcoin Ticker (`bitcoin_ticker`) : The ticker symbol for Bitcoin. Default is "BINANCE:BTCUSDT".
Functionality
Correlation Calculation : The script calculates the daily returns for both Bitcoin and the current ticker and computes their rolling correlation coefficient.
```pine
bitcoin_close = request.security(bitcoin_ticker, timeframe.period, close)
bitcoin_dailyReturn = ta.change(bitcoin_close) / bitcoin_close[1]
current_dailyReturn = ta.change(close) / close[1]
rolling_correlation = ta.correlation(current_dailyReturn, bitcoin_dailyReturn, length)
```
Smoothing : A simple moving average is applied to the rolling correlation coefficient to smooth the data.
```pine
smoothed_correlation = ta.sma(rolling_correlation, smoothing_length)
```
Plotting : The script plots the smoothed rolling correlation coefficient and includes horizontal lines for key levels.
```pine
plot(smoothed_correlation, title="Rolling Correlation with Bitcoin", color=color.rgb(255, 82, 82, 50), linewidth=2)
h_neg1 = hline(-1, "-1 Line", color=color.gray)
h_neg05 = hline(-0.5, "-0.5 Line", color=color.red)
h0 = hline(0, "Zero Line", color=color.gray)
h_pos05 = hline(0.5, "0.5 Line", color=color.green)
h1 = hline(1, "1 Line", color=color.gray)
fill(h_neg1, h_neg05, color=color.rgb(255, 0, 0, 90), title="Strong Negative Correlation Background")
fill(h_neg05, h0, color=color.rgb(255, 165, 0, 90), title="Weak Negative Correlation Background")
fill(h0, h_pos05, color=color.rgb(255, 255, 0, 90), title="Weak Positive Correlation Background")
fill(h_pos05, h1, color=color.rgb(0, 255, 0, 90), title="Strong Positive Correlation Background")
```
How to Use
- Configuring Inputs : Adjust the rolling window length and smoothing length as needed. Ensure the Bitcoin ticker is set to the desired asset for comparison.
- Interpreting the Indicator : Use the plotted correlation coefficient and horizontal lines to assess the strength and direction of the relationship between the current ticker and Bitcoin.
- Signal Confirmation : Look for periods of strong positive or negative correlation to identify potential co-movements or divergences. The background colors help to highlight these key levels.
This script provides a detailed comparative view of the correlation between the current ticker and Bitcoin, aiding in more informed decision-making by highlighting the strength and direction of their relationship.
开源脚本
秉承TradingView的精神,该脚本的作者将其开源,以便交易者可以查看和验证其功能。向作者致敬!您可以免费使用该脚本,但请记住,重新发布代码须遵守我们的网站规则。
免责声明
这些信息和出版物并非旨在提供,也不构成TradingView提供或认可的任何形式的财务、投资、交易或其他类型的建议或推荐。请阅读使用条款了解更多信息。
免责声明
这些信息和出版物并非旨在提供,也不构成TradingView提供或认可的任何形式的财务、投资、交易或其他类型的建议或推荐。请阅读使用条款了解更多信息。