PROTECTED SOURCE SCRIPT
Stablecoin Ratio with TPI Score
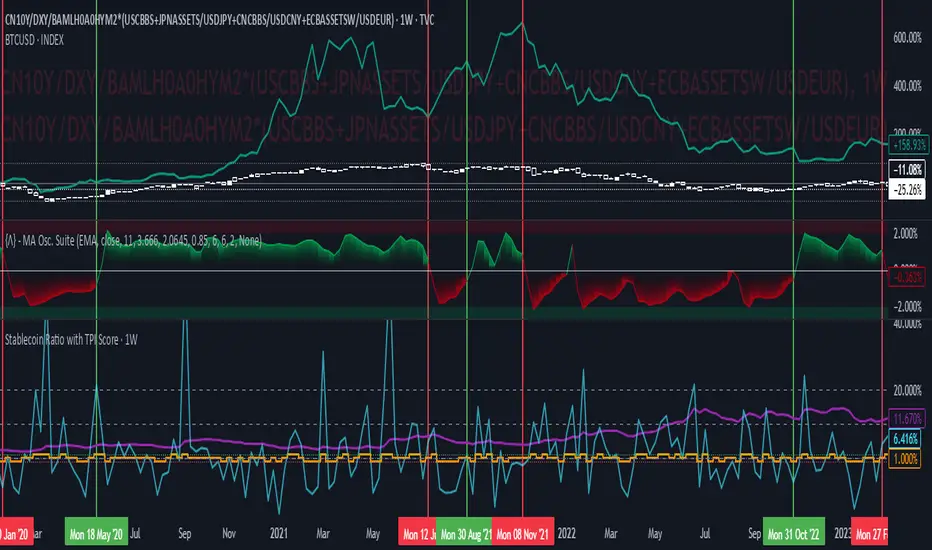
The script measures the stablecoin ratio (total stablecoin market cap divided by total crypto market cap, times 100) and its weekly change. Stablecoins (e.g., USDT, USDC) are a key gateway for capital entering or exiting the crypto ecosystem.
A rising ratio suggests more capital is parked in stablecoins (potential buying power), while a falling ratio indicates capital leaving (selling or withdrawal).
In a macro analysis, this is critical—it reflects the availability of liquid funds that could fuel price movements.
In macroeconomics, liquidity is a driver of asset prices.
In crypto, stablecoins represent sidelined capital ready to deploy.
How does it work?
Formula: (total_stablecoin_mcap / total_crypto_mcap) * 100.
Example: If stablecoins = $235B and total market cap = $2.5T, ratio = 9.4%.
Plotted as a red line in the oscillator pane, showing the percentage of the market held in stablecoins.
Calculates the percentage change in the ratio from the previous week:
(current_ratio - previous_ratio) / previous_ratio * 100.
Example: Ratio goes from 9% to 10% = +11.11% change.
*TPI Score Assignment:
+1 (Bullish): If the ratio increases by more than 5% week-over-week.
-1 (Bearish): If the ratio decreases by more than 5% week-over-week.
0 (Neutral): If the change is between -5% and +5%.
Plotted as orange step line bars in the oscillator pane, snapping to +1, 0, or -1.
A rising ratio suggests more capital is parked in stablecoins (potential buying power), while a falling ratio indicates capital leaving (selling or withdrawal).
In a macro analysis, this is critical—it reflects the availability of liquid funds that could fuel price movements.
In macroeconomics, liquidity is a driver of asset prices.
In crypto, stablecoins represent sidelined capital ready to deploy.
How does it work?
- Stablecoin Ratio:
Formula: (total_stablecoin_mcap / total_crypto_mcap) * 100.
Example: If stablecoins = $235B and total market cap = $2.5T, ratio = 9.4%.
Plotted as a red line in the oscillator pane, showing the percentage of the market held in stablecoins.
- Weekly Change:
Calculates the percentage change in the ratio from the previous week:
(current_ratio - previous_ratio) / previous_ratio * 100.
Example: Ratio goes from 9% to 10% = +11.11% change.
*TPI Score Assignment:
+1 (Bullish): If the ratio increases by more than 5% week-over-week.
-1 (Bearish): If the ratio decreases by more than 5% week-over-week.
0 (Neutral): If the change is between -5% and +5%.
Plotted as orange step line bars in the oscillator pane, snapping to +1, 0, or -1.
受保护脚本
此脚本以闭源形式发布。 但是,您可以自由使用,没有任何限制 — 了解更多信息这里。
免责声明
这些信息和出版物并非旨在提供,也不构成TradingView提供或认可的任何形式的财务、投资、交易或其他类型的建议或推荐。请阅读使用条款了解更多信息。
免责声明
这些信息和出版物并非旨在提供,也不构成TradingView提供或认可的任何形式的财务、投资、交易或其他类型的建议或推荐。请阅读使用条款了解更多信息。