OPEN-SOURCE SCRIPT
RSI based support resistance levels

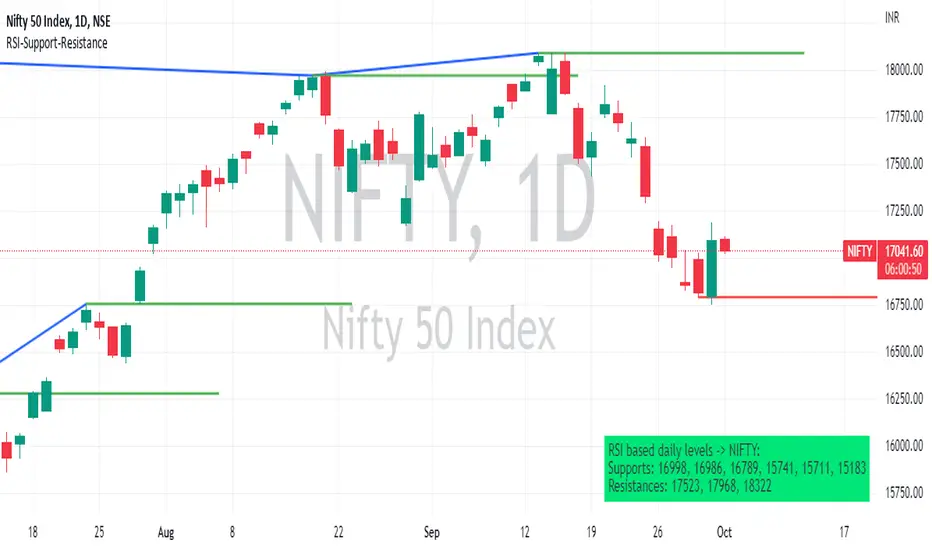
This indicator draws support line and resistance lines in the price chart.
How ?
For drawing the support/resistance line we need to first determine the demand and supply.
We are using too-familiar indicator RSI to determine when the script is oversold and overbought.
Now oversold (in RSI) is not a point, it’s a zone. The RSI indicator comes below 30, stays there and goes up above 30. Similarly for overbought.
Now if you carefully look at the oversold region – the lowest point of the oversold region is the place where the demand came (for surety) and push the indicator (and price) up.
Similarly: the highest point of overbought is the place where (for surety) the supply came and push the indicator (and price) down.
So that’ the supply / demand line (for surety).
In this indicator, based on the RSI we are just drawing support and resistance lines in the chat. That’s all.
What is unique ?
Trendline concept is not new. RSI is not new. RSI overbought/oversold is not new.
There are indicators exist to draw trendlines. Some of them works beautifully.
However, none of these, we are aware of, uses RSI to determine it. And, we believe, the most logical way to determine support/resistance is RSI.
Note: We are not responsible for any trading/investment decision you are taking out of the outcome of this indicator.
版本注释
In the first version of the script, we have the only one period RSI support (default: 14).In this version of the script, we are adding two features:
- Multiple RSI period Support/Resistance (e.g. 7, 14, 21, 28). You can turn off also through a boolean switch.
- The slanted trendlines. Often in trading, only horizontal support/resistance lines are not enough, you may also need a slanted trendlines. It's for that.
The Logic of creating slanted trendlines are simple: Just follow the RSI path. The way RSI goes through from overbought to oversold (or vice versa), just draw a line following these two price points in the chart. Simple, but works!
版本注释
I think people are getting Very Confused with so many lines. Sorry.So now, by default, turned off the slanted trendlines (blue colored).
User can, of course, turn it ON if user wishes so. (Please check the last toggle control on the indicator's settings).
版本注释
One more feature is added.Showing a table besides the chart to show the Support/Resistance levels for easiler consumption.
Also the same table data is available in an alert, if someone wants to use it.
版本注释
Some more updates. We just added an alert of Daily levels (in Daily timeframe).
User can potentially sets up the alert to keep the chart in the Daily timeframe to receive the alerts.
开源脚本
秉承TradingView的精神,该脚本的作者将其开源,以便交易者可以查看和验证其功能。向作者致敬!您可以免费使用该脚本,但请记住,重新发布代码须遵守我们的网站规则。
免责声明
这些信息和出版物并非旨在提供,也不构成TradingView提供或认可的任何形式的财务、投资、交易或其他类型的建议或推荐。请阅读使用条款了解更多信息。
开源脚本
秉承TradingView的精神,该脚本的作者将其开源,以便交易者可以查看和验证其功能。向作者致敬!您可以免费使用该脚本,但请记住,重新发布代码须遵守我们的网站规则。
免责声明
这些信息和出版物并非旨在提供,也不构成TradingView提供或认可的任何形式的财务、投资、交易或其他类型的建议或推荐。请阅读使用条款了解更多信息。