INVITE-ONLY SCRIPT
ChaosSN Reversal Signals
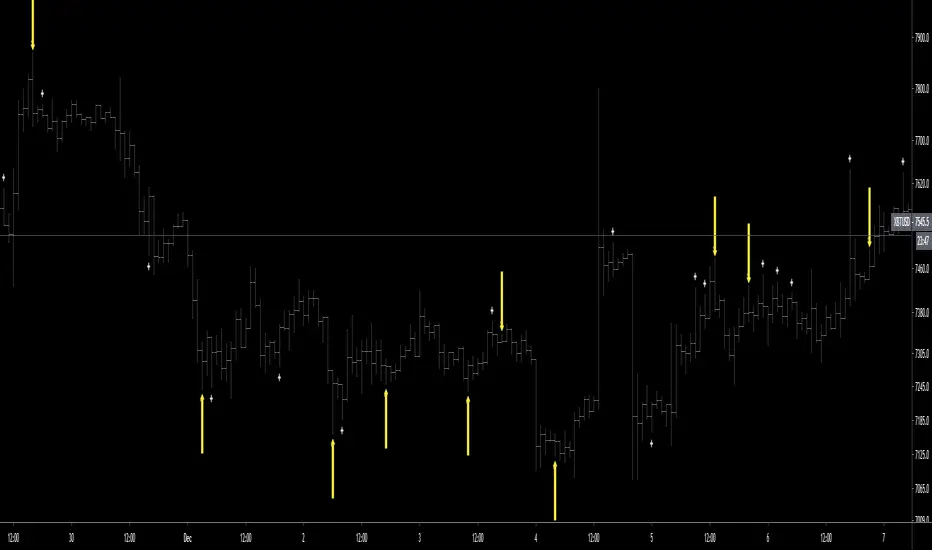
I calculated various metrics to measure exhaustion and mean diversion to plot arrows for a likely reversal point.
Use the input window to tailor the sensitivity of the arrows based on the amount of volatility your chart is experiencing (lower = more sensistive). The most common inputs for me are 8, 13, 21.
Use the input window to tailor the sensitivity of the arrows based on the amount of volatility your chart is experiencing (lower = more sensistive). The most common inputs for me are 8, 13, 21.
仅限邀请脚本
只有作者授权的用户才能访问此脚本。您需要申请并获得使用许可。通常情况下,付款后即可获得许可。更多详情,请按照下方作者的说明操作,或直接联系TheTimeCount。
TradingView不建议您付费购买或使用任何脚本,除非您完全信任其作者并了解其工作原理。您也可以在我们的社区脚本找到免费的开源替代方案。
作者的说明
DM me for access to the private indicators twitter.com/TheTimeCount
免责声明
这些信息和出版物并非旨在提供,也不构成TradingView提供或认可的任何形式的财务、投资、交易或其他类型的建议或推荐。请阅读使用条款了解更多信息。