OPEN-SOURCE SCRIPT
QSL Upside/Downside
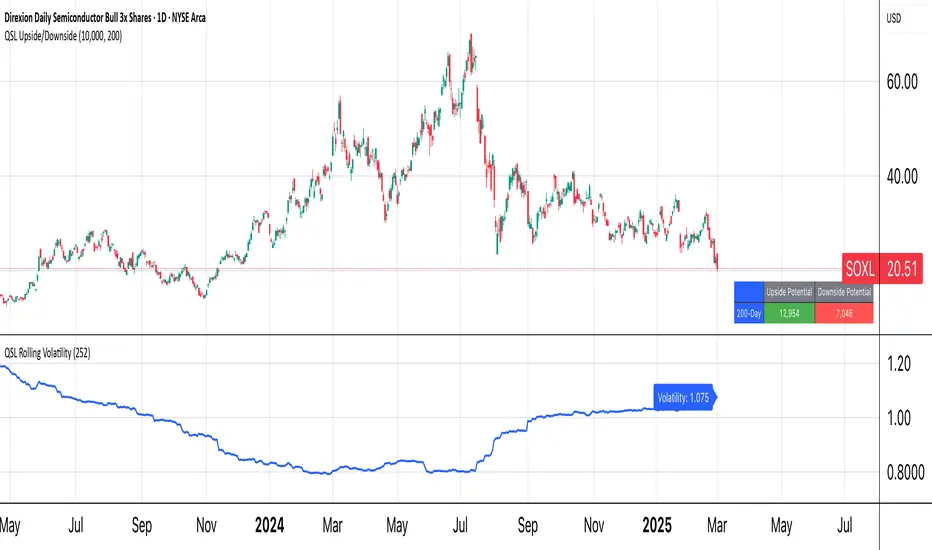
The QSL Upside/Downside Indicator helps traders estimate potential gains and losses using Conditional Value at Risk (cVaR), a statistical measure that assesses both downside risk and upside potential beyond standard volatility. Instead of fixed timeframes (daily, weekly, etc.), traders can set a custom lookback period (in days) to analyze market behavior over their preferred time frame.
How It Works
The indicator calculates cVaR over the chosen period to determine how much an investment could move up or down based on past price behavior. It does this by:
• Mean Return – The average price movement over the period.
• Standard Deviation – Measures price fluctuations from the average.
• cVaR Confidence Interval (95%) – Estimates worst-case losses, meaning the downside projection reflects the worst 5% of expected losses.
• Upside Potential (Best 5%) – Instead of only considering risk, this indicator also calculates the potential upside by measuring returns in the top 5% of past price movements.
This provides a more complete view of what traders can expect—both in terms of risk and potential reward.
Key Features
✅ Custom Lookback Period – Set any number of days to analyze.
✅ cVaR Calculation (95% Confidence Interval) – Identifies extreme downside risks.
✅ Upside Potential (Best 5%) – Estimates how much an investment could rise in a best-case scenario.
✅ Clear Table Display – Quickly see projected best and worst-case portfolio values.
Understanding Probabilities: Upside & Downside Potential
Most traders focus on risk, but it’s equally important to understand potential gains. This indicator provides a probability-based view of expected market moves:
• 95% Confidence Interval (Downside cVaR) – There’s a 5% chance that losses could exceed this level.
• 95% Confidence Interval (Upside cVaR) – There’s a 5% chance that gains could be greater than this level.
• The remaining 90% of expected returns fall between these two extremes.
By knowing both potential losses and gains, traders can make more balanced, data-driven decisions rather than only focusing on worst-case scenarios.
Why Use This Indicator?
🔹 Better Risk & Reward Assessment – Understand both downside risk and upside potential.
🔹 More Realistic Market Projections – Uses probabilities instead of simple historical averages.
🔹 Flexible & Customizable – Works with any asset and any time period.
With this tool, QSL members can strategically plan trades, knowing the expected best and worst-case outcomes with a 95% probability range. 🚀
开源脚本
秉承TradingView的精神,该脚本的作者将其开源,以便交易者可以查看和验证其功能。向作者致敬!您可以免费使用该脚本,但请记住,重新发布代码须遵守我们的网站规则。
免责声明
这些信息和出版物并非旨在提供,也不构成TradingView提供或认可的任何形式的财务、投资、交易或其他类型的建议或推荐。请阅读使用条款了解更多信息。
开源脚本
秉承TradingView的精神,该脚本的作者将其开源,以便交易者可以查看和验证其功能。向作者致敬!您可以免费使用该脚本,但请记住,重新发布代码须遵守我们的网站规则。
免责声明
这些信息和出版物并非旨在提供,也不构成TradingView提供或认可的任何形式的财务、投资、交易或其他类型的建议或推荐。请阅读使用条款了解更多信息。