OPEN-SOURCE SCRIPT
Candle Range Theory
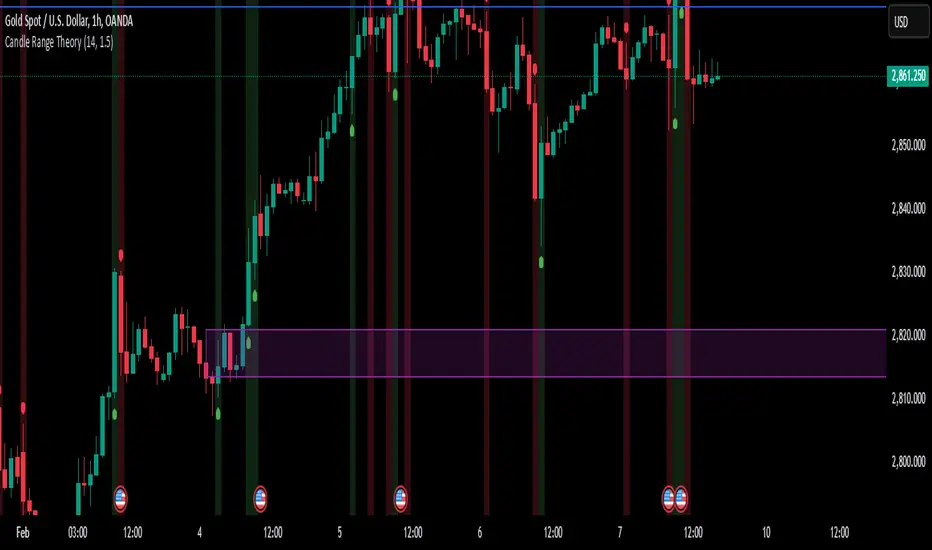
Candle Range Analysis:
Calculates the true range of each candle
Shows a 14-period SMA of the range (adjustable)
Dynamic bands based on standard deviation
Visual Components:
Colored histogram showing range deviations from mean
Signal line for oscillator smoothing
Expansion/contraction zones marked with dotted lines
Arrow markers for extreme range conditions
Key Functionality:
Identifies range expansion/contraction relative to historical volatility
Shows normalized range oscillator (-100% to +100% scale)
Includes visual and audio alerts for extreme range conditions
Customizable parameters for sensitivity and smoothing
Interpretation:
Red zones indicate above-average volatility/expansion
Green zones indicate below-average volatility/contraction
Crossings above/below zero line show range expansion/contraction
Signal line crossover system potential
开源脚本
秉承TradingView的精神,该脚本的作者将其开源,以便交易者可以查看和验证其功能。向作者致敬!您可以免费使用该脚本,但请记住,重新发布代码须遵守我们的网站规则。
免责声明
这些信息和出版物并非旨在提供,也不构成TradingView提供或认可的任何形式的财务、投资、交易或其他类型的建议或推荐。请阅读使用条款了解更多信息。
免责声明
这些信息和出版物并非旨在提供,也不构成TradingView提供或认可的任何形式的财务、投资、交易或其他类型的建议或推荐。请阅读使用条款了解更多信息。