INVITE-ONLY SCRIPT
Trend vs Mean Reversion Indicator (ADF Test) {DCAquant}
ADF Trend/Mean Reversion Analysis Indicator {DCAquant}
The ADF Trend/Mean Reversion Analysis Indicator, is a groundbreaking tool engineered to discern the underlying structure of financial markets. It employs the esteemed Augmented Dickey-Fuller (ADF) test to analyze time series data, providing traders with a robust statistical basis to distinguish between trending and mean-reverting market environments.
Comprehensive Market Analysis:
Advanced Statistical Foundation: Leverages the ADF test to statistically evaluate the likelihood of a trend sustaining or a reversion to the mean, making it a critical component of a quantitative trader’s toolkit.
Market Condition Visualization: The indicator’s color-coded system serves as a visual guide to the current market state, helping traders identify shifts in market dynamics with ease.
Configurable Sensitivity: Customizable parameters allow for fine-tuning the indicator's responsiveness, ensuring adaptability across various assets and market conditions.
Enhanced Indicator Features:
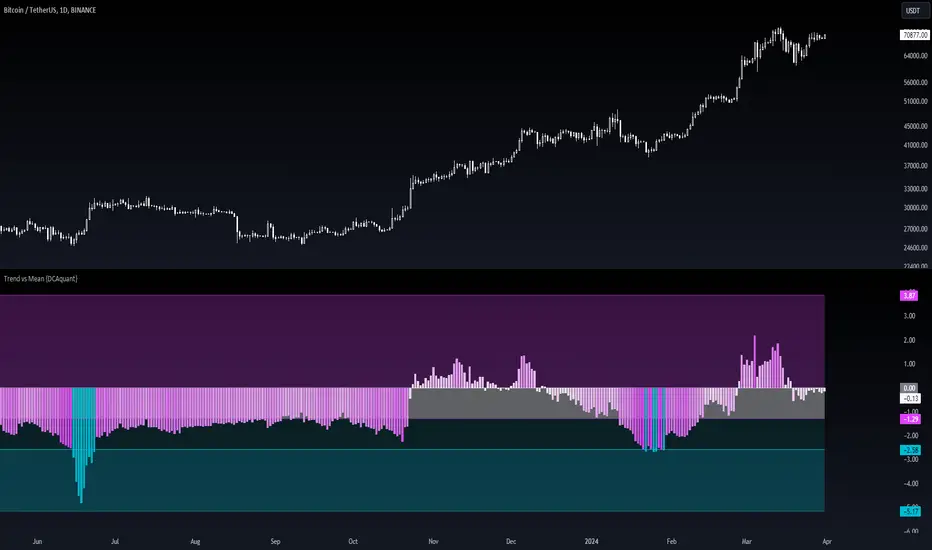
Aqua and Teal Bars: Depict a market that is statistically more inclined toward mean reversion, potentially signaling retracements or reversals, hence providing strategic points for counter-trend entries.
Fuchsia and Purple Bars: Identify a trending market regime where the persistence of price direction is statistically significant, thus supporting strategies that follow the trend.
Adaptive to Market Caps and Assets: Whether applied to broad market indices or individual securities, this indicator dynamically adjusts, making it an invaluable asset for diverse trading portfolios.
Strategic Trading Implications:
Dual-Strategy Adaptation: The indicator's nuanced presentation allows traders to switch between trend-following and counter-trend strategies, providing a flexible approach to both long-term investors and short-term traders.
Robust Signal Confirmation: It enhances trade confirmation when used alongside other technical indicators such as moving averages, momentum oscillators, or volume-based measures, offering a multi-layered analysis.
Informed Decision Making: By understanding the statistical tendencies of market behavior, traders can make more informed decisions that align with their individual risk profiles and trading objectives.
Customization and Optimization:
Selectable Confidence Levels: Choose from 90%, 95%, or 99% confidence levels to match the statistical rigor with your risk appetite.
Flexible Source and Lookback Periods: Adjust the price source and historical window to optimize the ADF test's application to different trading styles and timeframes, from intra-day to long-term analysis.
In-depth Indicator Usage:
Mean Reversion Opportunities: Utilize the indicator's mean-reverting signals to identify potential tops or bottoms, and adjust your position sizes and stop-loss placements accordingly.
Trend Continuation: In trending phases, use the indicator’s readings to reinforce your conviction in holding positions, managing trades with the confidence of statistical backing.
Disclaimer and Best Practices:
The ADF Trend/Mean Reversion Analysis Indicator {DCAquant} represents a fusion of statistical theory and technical analysis, designed to augment the trader's insight. It is intended to be used as a component of a holistic trading strategy. While it offers a sophisticated analysis, all traders are advised to apply rigorous risk management and not to rely solely on one indicator for trading signals.
The ADF Trend/Mean Reversion Analysis Indicator, is a groundbreaking tool engineered to discern the underlying structure of financial markets. It employs the esteemed Augmented Dickey-Fuller (ADF) test to analyze time series data, providing traders with a robust statistical basis to distinguish between trending and mean-reverting market environments.
Comprehensive Market Analysis:
Advanced Statistical Foundation: Leverages the ADF test to statistically evaluate the likelihood of a trend sustaining or a reversion to the mean, making it a critical component of a quantitative trader’s toolkit.
Market Condition Visualization: The indicator’s color-coded system serves as a visual guide to the current market state, helping traders identify shifts in market dynamics with ease.
Configurable Sensitivity: Customizable parameters allow for fine-tuning the indicator's responsiveness, ensuring adaptability across various assets and market conditions.
Enhanced Indicator Features:
Aqua and Teal Bars: Depict a market that is statistically more inclined toward mean reversion, potentially signaling retracements or reversals, hence providing strategic points for counter-trend entries.
Fuchsia and Purple Bars: Identify a trending market regime where the persistence of price direction is statistically significant, thus supporting strategies that follow the trend.
Adaptive to Market Caps and Assets: Whether applied to broad market indices or individual securities, this indicator dynamically adjusts, making it an invaluable asset for diverse trading portfolios.
Strategic Trading Implications:
Dual-Strategy Adaptation: The indicator's nuanced presentation allows traders to switch between trend-following and counter-trend strategies, providing a flexible approach to both long-term investors and short-term traders.
Robust Signal Confirmation: It enhances trade confirmation when used alongside other technical indicators such as moving averages, momentum oscillators, or volume-based measures, offering a multi-layered analysis.
Informed Decision Making: By understanding the statistical tendencies of market behavior, traders can make more informed decisions that align with their individual risk profiles and trading objectives.
Customization and Optimization:
Selectable Confidence Levels: Choose from 90%, 95%, or 99% confidence levels to match the statistical rigor with your risk appetite.
Flexible Source and Lookback Periods: Adjust the price source and historical window to optimize the ADF test's application to different trading styles and timeframes, from intra-day to long-term analysis.
In-depth Indicator Usage:
Mean Reversion Opportunities: Utilize the indicator's mean-reverting signals to identify potential tops or bottoms, and adjust your position sizes and stop-loss placements accordingly.
Trend Continuation: In trending phases, use the indicator’s readings to reinforce your conviction in holding positions, managing trades with the confidence of statistical backing.
Disclaimer and Best Practices:
The ADF Trend/Mean Reversion Analysis Indicator {DCAquant} represents a fusion of statistical theory and technical analysis, designed to augment the trader's insight. It is intended to be used as a component of a holistic trading strategy. While it offers a sophisticated analysis, all traders are advised to apply rigorous risk management and not to rely solely on one indicator for trading signals.
仅限邀请脚本
只有作者授权的用户才能访问此脚本。您需要申请并获得使用许可。通常情况下,付款后即可获得许可。更多详情,请按照下方作者的说明操作,或直接联系DCAquant。
请注意,此私密、仅限邀请脚本未经脚本版主审核,是否符合网站规则尚未确定。 TradingView不建议您付费购买或使用任何脚本,除非您完全信任其作者并了解其工作原理。您也可以在我们的社区脚本找到免费的开源替代方案。
作者的说明
Please visit dcaquant.com or contact us via info@dcaquant.com or directly on TradingView.
免责声明
这些信息和出版物并非旨在提供,也不构成TradingView提供或认可的任何形式的财务、投资、交易或其他类型的建议或推荐。请阅读使用条款了解更多信息。