OPEN-SOURCE SCRIPT
已更新 Strat Trail Stop by AlexsOptions
What does this script do?
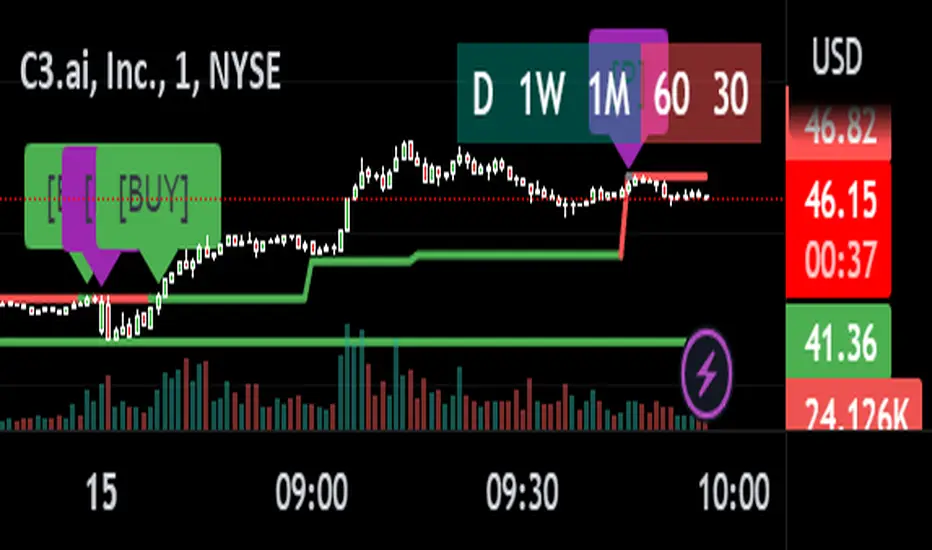
This script plots previous aggregation highs or lows based on the trend of the candles.
Scenario 1 -> Up Trend
If the previous high of a candle is violated the green trail line will trail using the lows of the prior candle. It will continue until a previous low is violated. Once a previous low is violated it will switch to scenario 2
Scenario 2 -> Down Trend
If the previous low of a candle is violated the red trail line will trail using the highs of the prior candle. It will continue until a previous high is violated. Once a previous high is violated it will switch to scenario 1
This indicator has two trails. One is expected to be a lower timeframe the other a higher timeframe.
The higher timeframe has an option to instead use the open of the higher timeframe instead of the trail logic in the scenarios above.
If selected it will plot the open of the designated timeframe, the color will be green if trading above and red if trading below
This script is best used in conjunction with a good understanding of #TheStrat trading strategy. You are then able to create alerts for when your positions fall out of favor.
版本注释
Started adding buy and sell signals based on trail stop continuity [same colors] and negating continuity.Currently only the buyside will be working as this is a work in progress.
Thanks for checking it out!
开源脚本
秉承TradingView的精神,该脚本的作者将其开源,以便交易者可以查看和验证其功能。向作者致敬!您可以免费使用该脚本,但请记住,重新发布代码须遵守我们的网站规则。
免责声明
这些信息和出版物并非旨在提供,也不构成TradingView提供或认可的任何形式的财务、投资、交易或其他类型的建议或推荐。请阅读使用条款了解更多信息。
开源脚本
秉承TradingView的精神,该脚本的作者将其开源,以便交易者可以查看和验证其功能。向作者致敬!您可以免费使用该脚本,但请记住,重新发布代码须遵守我们的网站规则。
免责声明
这些信息和出版物并非旨在提供,也不构成TradingView提供或认可的任何形式的财务、投资、交易或其他类型的建议或推荐。请阅读使用条款了解更多信息。