OPEN-SOURCE SCRIPT
FT-RSI
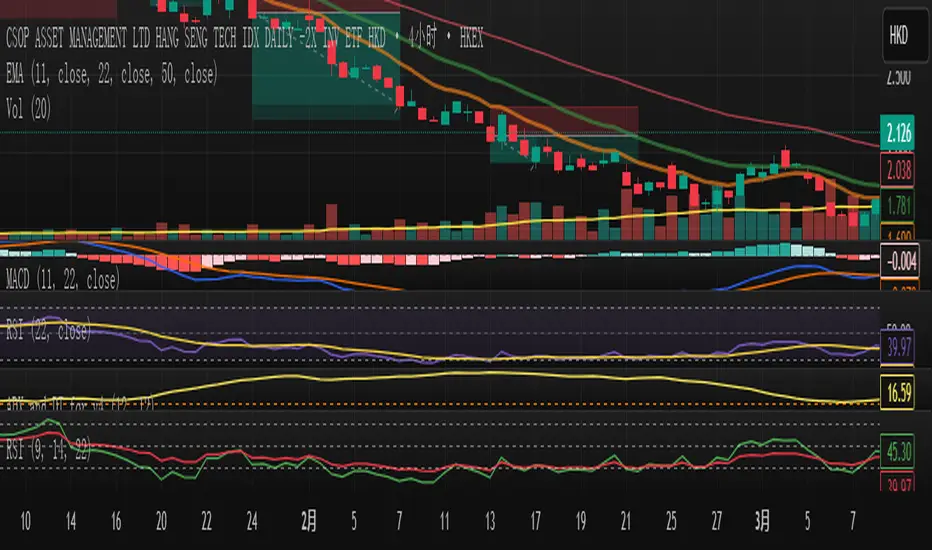
Summary of the Custom RSI Indicator Script (For Futu Niuniu Platform):
This Pine Script code implements a triple-period RSI indicator with horizontal reference lines (70, 50, 30) for technical analysis on the Futu Niuniu trading platform.
Key Features:
Multi-period RSI Calculation:
Computes three RSI values using 9, 14, and 22-period lengths to capture short-term, standard, and smoothed momentum signals.
Utilizes the Relative Moving Average (RMA) method for RSI calculation (ta.rma function).
Horizontal Reference Bands:
Upper Band (70): Red dotted line (semi-transparent) to identify overbought conditions.
Middle Band (50): Green dotted line as the neutral equilibrium level.
Lower Band (30): Blue dotted line (semi-transparent) to highlight oversold zones.
Visual Customization:
Distinct colors for each RSI line:
RSI (9): Orange (#F79A00)
RSI (14): Green (#49B50D)
RSI (22): Blue (#5188FF)
All lines have a thickness of 2 pixels for clear visibility.
Platform Compatibility:
This script is designed for Futu Niuniu’s charting system, leveraging Pine Script syntax adaptations supported by the platform. The horizontal bands and multi-period RSI logic help traders analyze trend strength and potential reversal points efficiently.
Note: Ensure Futu Niuniu’s scripting environment supports ta.rma and hline functions for proper execution.
开源脚本
秉承TradingView的精神,该脚本的作者将其开源,以便交易者可以查看和验证其功能。向作者致敬!您可以免费使用该脚本,但请记住,重新发布代码须遵守我们的网站规则。
免责声明
这些信息和出版物并非旨在提供,也不构成TradingView提供或认可的任何形式的财务、投资、交易或其他类型的建议或推荐。请阅读使用条款了解更多信息。
开源脚本
秉承TradingView的精神,该脚本的作者将其开源,以便交易者可以查看和验证其功能。向作者致敬!您可以免费使用该脚本,但请记住,重新发布代码须遵守我们的网站规则。
免责声明
这些信息和出版物并非旨在提供,也不构成TradingView提供或认可的任何形式的财务、投资、交易或其他类型的建议或推荐。请阅读使用条款了解更多信息。