PINE LIBRARY
已更新 fibpoint
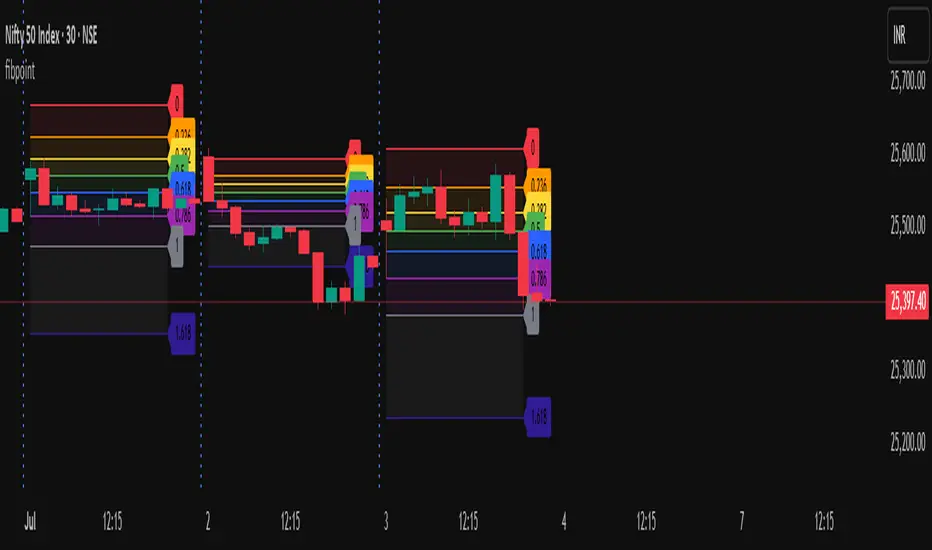
Library "fibpoint"
A library for generating Fibonacci retracement levels on a chart, including customizable lines, labels, and filled areas between levels. It provides functionality to plot Fibonacci levels based on given price points and bar indices, with options for custom levels and colors.
getFib(startPoint, endPoint, startIdx, endIdx, fibLevels, fibColors, tsp)
Calculates Fibonacci retracement levels between two price points and draws corresponding lines and labels on the chart.
Parameters:
startPoint (float): The starting price point for the Fibonacci retracement.
endPoint (float): The ending price point for the Fibonacci retracement.
startIdx (int): The bar index where the Fibonacci retracement starts.
endIdx (int): The bar index where the Fibonacci retracement ends.
fibLevels (array<float>): An optional array of custom Fibonacci levels (default is [0.0, 0.236, 0.382, 0.5, 0.618, 0.786, 1.0, 1.618]).
fibColors (array<color>): An optional array of colors for each Fibonacci level (default is a predefined color array).
tsp (int): The transparency level for the fill between Fibonacci levels (default is 90).
Returns: A tuple containing an array of fibItem objects (each with a line and label) and an array of linefill objects for the filled areas between levels.
fibItem
A custom type representing a Fibonacci level with its associated line and label.
Fields:
line (series line): The line object drawn for the Fibonacci level.
label (series label): The label object displaying the Fibonacci level value.
版本注释
v2Normalized Price Points: Version 2 introduces direction ("up" or "down") and normalizes start (sp) and end (ep) prices using math.min/max, ensuring consistent Fibonacci price calculations without reversing level or color arrays:
Pine脚本库
秉承TradingView的精神,作者已将此Pine代码作为开源库发布,以便我们社区的其他Pine程序员可以重用它。向作者致敬!您可以私下或在其他开源出版物中使用此库,但在出版物中重用此代码须遵守网站规则。
免责声明
这些信息和出版物并非旨在提供,也不构成TradingView提供或认可的任何形式的财务、投资、交易或其他类型的建议或推荐。请阅读使用条款了解更多信息。
Pine脚本库
秉承TradingView的精神,作者已将此Pine代码作为开源库发布,以便我们社区的其他Pine程序员可以重用它。向作者致敬!您可以私下或在其他开源出版物中使用此库,但在出版物中重用此代码须遵守网站规则。
免责声明
这些信息和出版物并非旨在提供,也不构成TradingView提供或认可的任何形式的财务、投资、交易或其他类型的建议或推荐。请阅读使用条款了解更多信息。