OPEN-SOURCE SCRIPT
CUSTOM intraday volatility chart clock
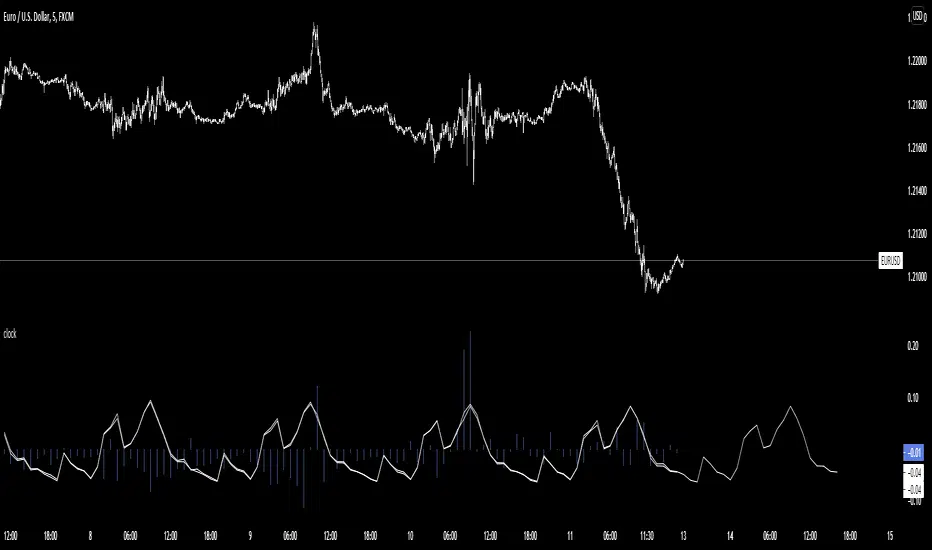
Chart clock showing an overview of the day's expected and actual intraday volatility.
In white are only the expected volatility scores. The expected increase or decrease in volatility at any given hour of day compared to the average of the whole day's expected volatility. A 0.5 score two hours from now means that you can expect that hour to be 0.5% more volatile than the average of whole day's volatility.
In blue are the actual or realized volatility scores; the difference between that hour's volatility and what was expected to be its volatility is displayed as a blue bar. If two three hours ago was expected to be a more volatile hour of the day but no movement occurred, a large down bar will print for that hour.
Large swings of daily volatility (i.e. this month is much more or much less volatility than the last) will bias the clock usually only a little higher or lower, although historical volatility peaks/depressions will show the blue realized volatility score to be consistently high/low.
If requested I can change the look of the indicator or add input settings for the input length of clock, which for now is set to 20 bars, which is an approximation of the last month's realized volatility.
开源脚本
秉承TradingView的精神,该脚本的作者将其开源,以便交易者可以查看和验证其功能。向作者致敬!您可以免费使用该脚本,但请记住,重新发布代码须遵守我们的网站规则。
免责声明
这些信息和出版物并非旨在提供,也不构成TradingView提供或认可的任何形式的财务、投资、交易或其他类型的建议或推荐。请阅读使用条款了解更多信息。
免责声明
这些信息和出版物并非旨在提供,也不构成TradingView提供或认可的任何形式的财务、投资、交易或其他类型的建议或推荐。请阅读使用条款了解更多信息。