RSI Shadow by Tartigradia
Have you ever wondered how much the RSI can vary during an open session? How much wicks can make the RSI overshoots before it retraces for the close?
This indicator plots the RSI shadow, which is the area between the highest and lowest RSI values attained during each open session, from the high/low wick price candle (ie, not the open value).
Technically, we calculate the RSI as usual for all past bars, except for current bar for which we use the high and low values to calculate the RSI Shadow bounds. The invisible PineScript loop then repeats this process for each bar.
In practice, the RSI Shadow provides 2 different informations:
1. This allows to visually represent the variability that historically happened for each bar, which help in better understanding the context at the time and may help predict future similar patterns.
2. The closer the RSI is to one bound, high or low, the more bullish or bearish respectively the price action is. Intuitively, when RSI is close to the high shadow bound, it means that price action is so bullish it often closes in proximity to the highest value attained during the open session, hence very bullish sentiment. And inversely for low and bearish sentiment. To ease visualization of these sentiments, a background highlighting is provided.
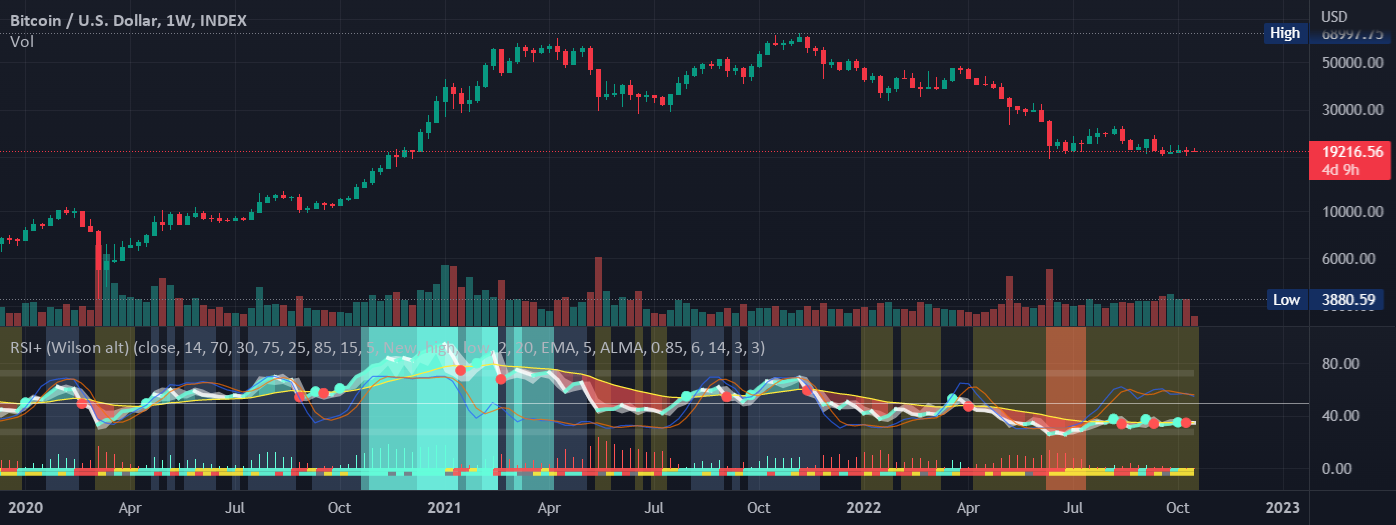
The indicator works under all timeframes, but it appears to provide a very reliable information with longer timeframe. The background highlighting showing the bullish/bearish sentiment based on the RSI Shadow appears to indicate crypto market cycles relatively reliably, with 2-3 consecutive bars with the same background color indicating a strong trend.
False positives can be reduced by looking at both the background color and the RSI direction, if both are congruent (ie, both bullish), then the trend indication is good, otherwise the trend indicated by the background color should be disregarded. An option was added to uncolor background if incongruent with RSI's direction.
There is also a "shadow margin" setting that allows to further reduce the number of false positives, at the expense of reduced sensitivity (a margin of 3 seems to eliminate most false positives).
Note: if you need a more complete RSI indicator with overbought/oversold signals, check out RSI+ (alt), which includes all RSI related indicators I make (such as RSI Shadow):

This indicator plots the RSI shadow, which is the area between the highest and lowest RSI values attained during each open session, from the high/low wick price candle (ie, not the open value).
Technically, we calculate the RSI as usual for all past bars, except for current bar for which we use the high and low values to calculate the RSI Shadow bounds. The invisible PineScript loop then repeats this process for each bar.
In practice, the RSI Shadow provides 2 different informations:
1. This allows to visually represent the variability that historically happened for each bar, which help in better understanding the context at the time and may help predict future similar patterns.
2. The closer the RSI is to one bound, high or low, the more bullish or bearish respectively the price action is. Intuitively, when RSI is close to the high shadow bound, it means that price action is so bullish it often closes in proximity to the highest value attained during the open session, hence very bullish sentiment. And inversely for low and bearish sentiment. To ease visualization of these sentiments, a background highlighting is provided.
The indicator works under all timeframes, but it appears to provide a very reliable information with longer timeframe. The background highlighting showing the bullish/bearish sentiment based on the RSI Shadow appears to indicate crypto market cycles relatively reliably, with 2-3 consecutive bars with the same background color indicating a strong trend.
False positives can be reduced by looking at both the background color and the RSI direction, if both are congruent (ie, both bullish), then the trend indication is good, otherwise the trend indicated by the background color should be disregarded. An option was added to uncolor background if incongruent with RSI's direction.
There is also a "shadow margin" setting that allows to further reduce the number of false positives, at the expense of reduced sensitivity (a margin of 3 seems to eliminate most false positives).
Note: if you need a more complete RSI indicator with overbought/oversold signals, check out RSI+ (alt), which includes all RSI related indicators I make (such as RSI Shadow):
版本注释:
* Incongruent bars now have their background highlighted in gray, instead of no highlight. This allows to differenciate insignificant difference (below margin) and incongruency. Incongruency may signal an upcoming trend change.
* Set margin to 1 by default, to showcase and slightly reduce the false positives rate.
* Set margin to 1 by default, to showcase and slightly reduce the false positives rate.