OPEN-SOURCE SCRIPT
Previous 5 Days OHLC + Dates + Prices
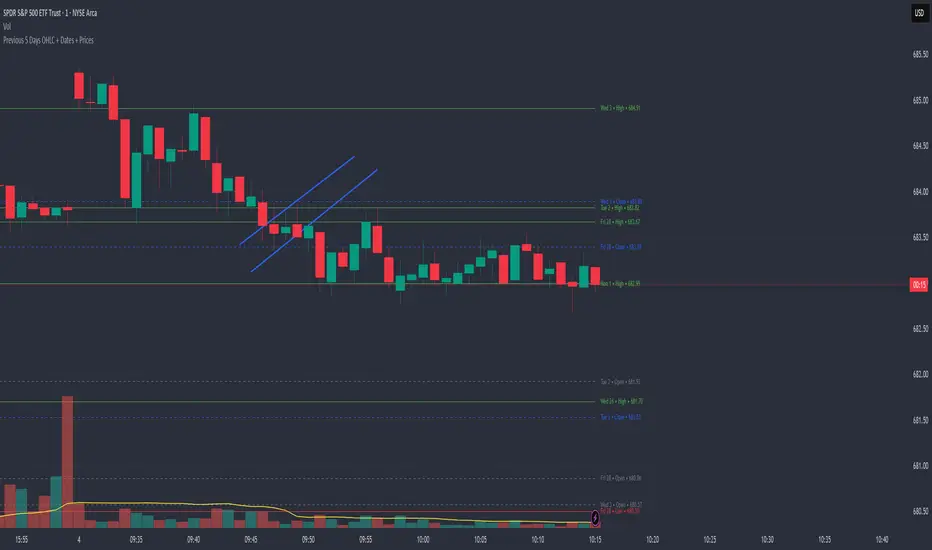
Title: Previous 5 Days OHLC Levels (Extended Lines + Labels)
Description:
This indicator automatically plots the Open, High, Low, and Close (OHLC) levels for the previous 5 trading days. Unlike standard daily separators, this tool extends the lines from their historical origin all the way to the current price bar, allowing traders to instantly see how current price action interacts with recent support and resistance levels.
Key Features:
5-Day Lookback: Automatically fetches and plots OHLC data for the last 5 trading sessions.
Extended Lines: Lines extend to the current bar (Right) to visualize immediate Support/Resistance zones.
Smart Labels: Each line is marked with the Day Name, Date, Type (O/H/L/C), and the Exact Price.
Customizable Positioning: Choose to display labels on the Left (start of the day) or the Right (next to current price) to keep your chart clean.
Toggle Visibility: Individually turn on/off Opens, Closes, Highs, or Lows to focus on the data that matters to your strategy.
How to Use:
Trend Analysis: Use previous Highs and Lows to identify potential breakout or breakdown levels.
Range Trading: Identify where price previously opened or closed to find intraday pivots.
Clean Charting: Use the settings to hide labels or specific lines (e.g., hide Opens/Closes to see only the Daily Range).
Settings:
Label Position: Switch between "Left" (historical origin) and "Right" (current price).
Visibility: Checkboxes to show/hide Open, High, Low, Close, and Text Labels.
Style: Fully customizable colors for each level type.
Technical Note: This script is optimized for performance (Pine Script v6). It uses array management and executes drawing logic only on the last bar to minimize resource usage while maintaining real-time accuracy.
开源脚本
秉承TradingView的精神,该脚本的作者将其开源,以便交易者可以查看和验证其功能。向作者致敬!您可以免费使用该脚本,但请记住,重新发布代码须遵守我们的网站规则。
免责声明
这些信息和出版物并非旨在提供,也不构成TradingView提供或认可的任何形式的财务、投资、交易或其他类型的建议或推荐。请阅读使用条款了解更多信息。
免责声明
这些信息和出版物并非旨在提供,也不构成TradingView提供或认可的任何形式的财务、投资、交易或其他类型的建议或推荐。请阅读使用条款了解更多信息。