OPEN-SOURCE SCRIPT
已更新 XAU 0/5 Grid
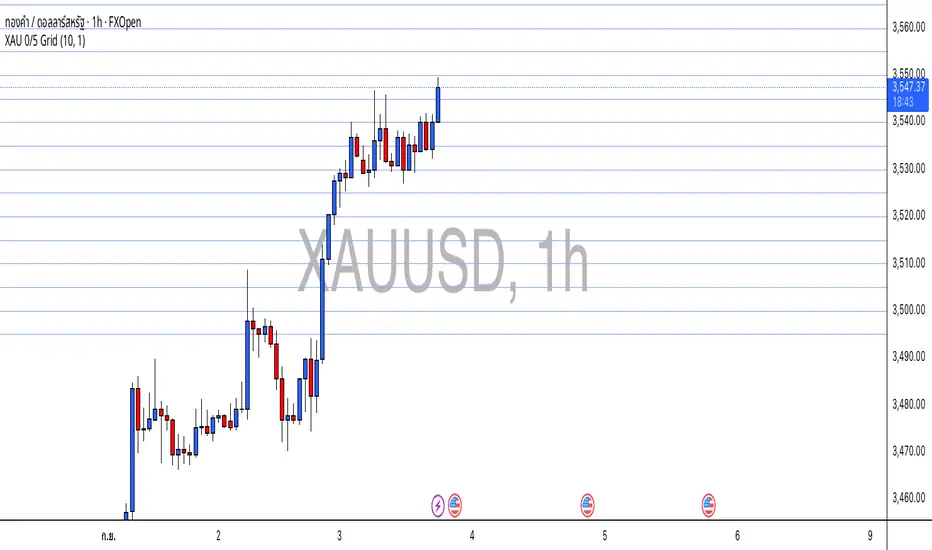
This indicator draws horizontal price grids for XAUUSD. It anchors the grid to a base price that ends with 0 or 5, then plots equally spaced levels every 5 price units above and below that base. It’s a clean way to eyeball fixed-interval structure for rough support/resistance zones and simple TP/SL planning.
How it works
Base (0/5):
base = floor(close / 5) × 5 → forces the base to always end with 0/5.
Grid levels:
level_i = base + i × 5, where i is any integer (positive/negative).
The script updates positions only when the base changes to avoid flicker and reduce chart load.
It uses a persistent line array to manage the line objects efficiently.
Usage
Add the indicator to an XAUUSD chart on any timeframe.
Configure in the panel:
Show Lines – toggle visibility
Lines each side – number of lines above/below the base
Line Color / Line Width – appearance
Use the grid as fixed reference levels (e.g., 3490, 3495, 3500, 3505, …) for planning TP/SL or observing grid breaks.
Highlights
Strict 0/5 anchoring keeps levels evenly spaced and easy to read on gold.
Auto-reanchors when price moves to a new 0/5 zone, maintaining a steady view.
Lightweight design: lines are created once and then updated, minimizing overhead.
Limitations
Visualization only — not a buy/sell signal.
Spacing is fixed at 5 price units, optimized for XAUUSD. If used on other symbols/brokers with different tick scales, adjust the logic accordingly.
Grid lines do not guarantee support/resistance; always combine with broader market context.
版本注释
fix bug版本注释
fix bug开源脚本
秉承TradingView的精神,该脚本的作者将其开源,以便交易者可以查看和验证其功能。向作者致敬!您可以免费使用该脚本,但请记住,重新发布代码须遵守我们的网站规则。
免责声明
这些信息和出版物并非旨在提供,也不构成TradingView提供或认可的任何形式的财务、投资、交易或其他类型的建议或推荐。请阅读使用条款了解更多信息。
免责声明
这些信息和出版物并非旨在提供,也不构成TradingView提供或认可的任何形式的财务、投资、交易或其他类型的建议或推荐。请阅读使用条款了解更多信息。