INVITE-ONLY SCRIPT
ssabu auto fibonacci indicator
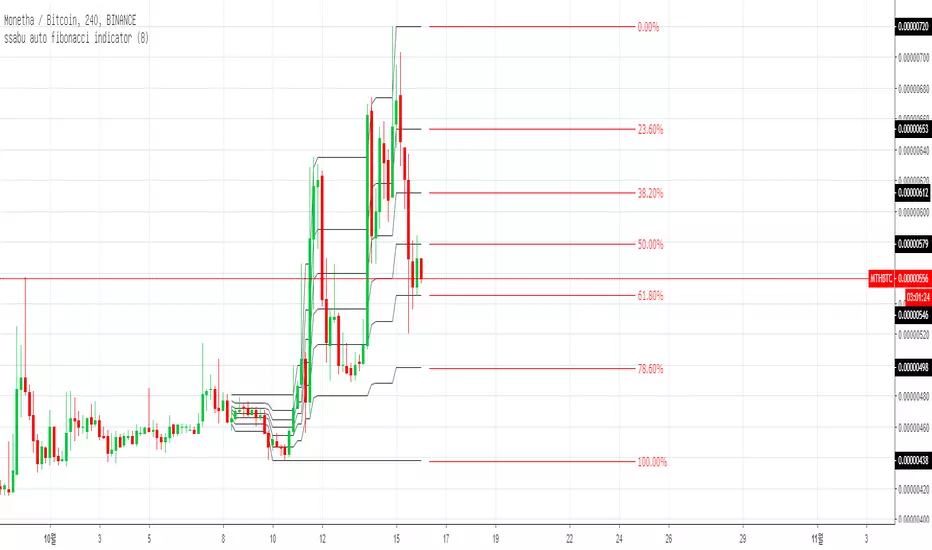
It is an index that automatically draws the Fibonacci ratio.
You can see the Fibonacci ratio you want to see by checking the rising trend and the falling trend in the setting, and you can set the peak time for the peak measurement to the input value.
The upward trend is automatically drawn with black lines like the above snapshot, and the downward trend is drawn with a blue line.
The red Fibonacci rate is drawn directly on the indicator.
────────────────────────────────────────────────────────────────────────────────────────────────────────────
자동으로 피보나치 비율을 그려주는 지표 입니다.
설정에서 상승추세와 하락추세를 체크하여 보고 싶은 추세의 피보나치 비율을 볼 수 있고 고점저점 측정 시간을 인풋값으로 설정해 줄 수 있습니다.
상승추세는 위의 스샷과 같이 검은선으로 자동으로 그려주고 하락추세는 파란선으로 그려줍니다.
빨간색의 피보나치 비율은 지표로 직접 그린것 입니다.
────────────────────────────────────────────────────────────────────────────────────────────────────────────
상승추세 스크린 샷
하락추세 스크린 샷
────────────────────────────────────────────────────────────────────────────────────────────────────────────
✅ Other indicators to help you trade
✅ 매매에 도움 되는 다른 지표

Basel major swing 2.0
【 트레이딩뷰 매니아 】
cafe.naver.com/tradingviewmania
【 트레이딩 시스템 】
tradingviewmania-menu.oopy.io/
【 카톡 】
bit.ly/싸부_문의1
【 텔레그램 】
bit.ly/싸부텔레
cafe.naver.com/tradingviewmania
【 트레이딩 시스템 】
tradingviewmania-menu.oopy.io/
【 카톡 】
bit.ly/싸부_문의1
【 텔레그램 】
bit.ly/싸부텔레
免责声明
这些信息和出版物并不意味着也不构成TradingView提供或认可的金融、投资、交易或其它类型的建议或背书。请在使用条款阅读更多信息。