OPEN-SOURCE SCRIPT
William's ProGo indicator
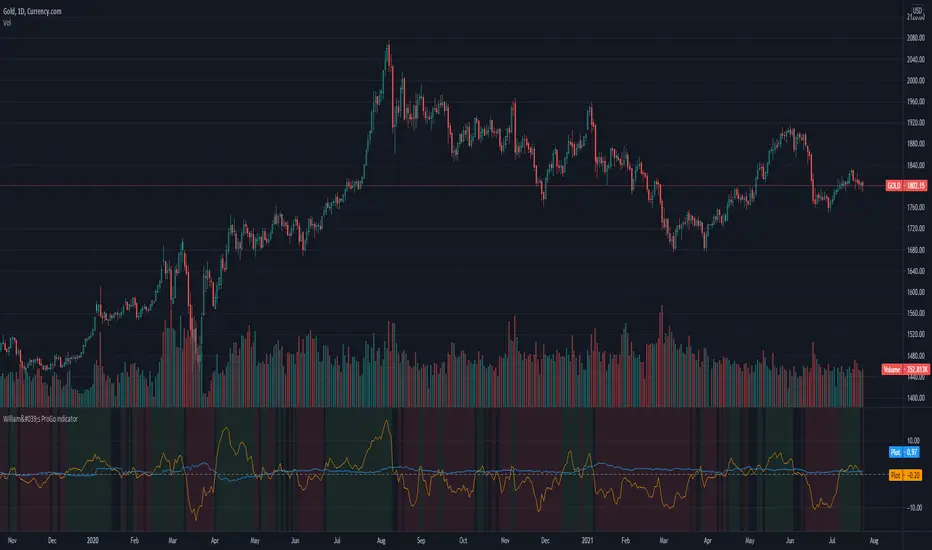
ProGo, created by Larry William, (earlier than 2002), is a 2 line graph using daily data.
1. Professional Line (color orange) is a professional Accumulation/Distribution line is constructed by using the change from today's open to today's close.
2. The Public Line (color blue) is done by creating a public accumulation/distribution line that shows the change from yesterdays close to today's open.
The graph is an index of the previous close to open +/- values (public) and then taking a 14 day average which is plotted against a 14 day average of the +/- values of the open to close(pro).
Background color:
Green colored area is where "pro" line crossover "amatuers" line, and the "pro" line is also positive.
Created this for literature review.
开源脚本
秉承TradingView的精神,该脚本的作者将其开源,以便交易者可以查看和验证其功能。向作者致敬!您可以免费使用该脚本,但请记住,重新发布代码须遵守我们的网站规则。
免责声明
这些信息和出版物并非旨在提供,也不构成TradingView提供或认可的任何形式的财务、投资、交易或其他类型的建议或推荐。请阅读使用条款了解更多信息。
开源脚本
秉承TradingView的精神,该脚本的作者将其开源,以便交易者可以查看和验证其功能。向作者致敬!您可以免费使用该脚本,但请记住,重新发布代码须遵守我们的网站规则。
免责声明
这些信息和出版物并非旨在提供,也不构成TradingView提供或认可的任何形式的财务、投资、交易或其他类型的建议或推荐。请阅读使用条款了解更多信息。