OPEN-SOURCE SCRIPT
已更新 Divergence Cheat Sheet

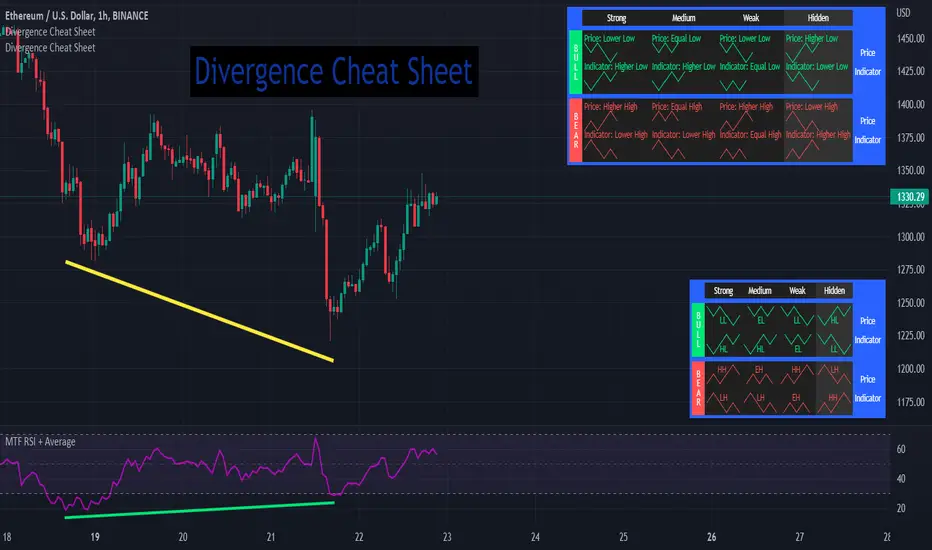
'Divergence Cheat Sheet' helps in understanding what to look for when identifying divergences between price and an indicator. The strength of a divergence can be strong, medium, or weak. Divergences are always most effective when references prior peaks and on higher time frames. The most common indicators to identify divergences with are the Relative Strength Index (RSI) and the Moving average convergence divergence (MACD).
Regular Bull Divergence: Indicates underlying strength. Bears are exhausted. Warning of a possible trend direction change from a downtrend to an uptrend.
Hidden Bull Divergence: Indicates underlying strength. Good entry or re-entry. This occurs during retracements in an uptrend. Nice to see during the price retest of previous lows. “Buy the dips."
Regular Bear Divergence: Indicates underlying weakness. The bulls are exhausted. Warning of a possible trend direction change from an uptrend to a downtrend.
Hidden Bear Divergence: Indicates underlying weakness. Found during retracements in a downtrend. Nice to see during price retests of previous highs. “Sell the rallies.”
Divergences can have different strengths.
Strong Bull Divergence
Medium Bull Divergence
Weak Bull Divergence
Hidden Bull Divergence
Strong Bear Divergence
Medium Bear Divergence
Weak Bear Divergence
Hidden Bull Divergence
Regular Bull Divergence: Indicates underlying strength. Bears are exhausted. Warning of a possible trend direction change from a downtrend to an uptrend.
Hidden Bull Divergence: Indicates underlying strength. Good entry or re-entry. This occurs during retracements in an uptrend. Nice to see during the price retest of previous lows. “Buy the dips."
Regular Bear Divergence: Indicates underlying weakness. The bulls are exhausted. Warning of a possible trend direction change from an uptrend to a downtrend.
Hidden Bear Divergence: Indicates underlying weakness. Found during retracements in a downtrend. Nice to see during price retests of previous highs. “Sell the rallies.”
Divergences can have different strengths.
Strong Bull Divergence
- Price: Lower Low
- Indicator: Higher Low
Medium Bull Divergence
- Price: Equal Low
- Indicator: Higher Low
Weak Bull Divergence
- Price: Lower Low
- Indicator: Equal Low
Hidden Bull Divergence
- Price: Higher Low
- Indicator: Higher Low
Strong Bear Divergence
- Price: Higher High
- Indicator: Lower High
Medium Bear Divergence
- Price: Equal High
- Indicator: Lower High
Weak Bear Divergence
- Price: Higher High
- Indicator: Equal High
Hidden Bull Divergence
- Price: Lower High
- Indicator: Higher High
版本注释
Tooltips added.开源脚本
秉承TradingView的精神,该脚本的作者将其开源,以便交易者可以查看和验证其功能。向作者致敬!您可以免费使用该脚本,但请记住,重新发布代码须遵守我们的网站规则。
tanhef.com/
Scripts and content from TanHef are solely for information and education. Past performance does not guarantee of future results.
Scripts and content from TanHef are solely for information and education. Past performance does not guarantee of future results.
免责声明
这些信息和出版物并非旨在提供,也不构成TradingView提供或认可的任何形式的财务、投资、交易或其他类型的建议或推荐。请阅读使用条款了解更多信息。
开源脚本
秉承TradingView的精神,该脚本的作者将其开源,以便交易者可以查看和验证其功能。向作者致敬!您可以免费使用该脚本,但请记住,重新发布代码须遵守我们的网站规则。
tanhef.com/
Scripts and content from TanHef are solely for information and education. Past performance does not guarantee of future results.
Scripts and content from TanHef are solely for information and education. Past performance does not guarantee of future results.
免责声明
这些信息和出版物并非旨在提供,也不构成TradingView提供或认可的任何形式的财务、投资、交易或其他类型的建议或推荐。请阅读使用条款了解更多信息。