PROTECTED SOURCE SCRIPT
Stochastic and MACD Histogram
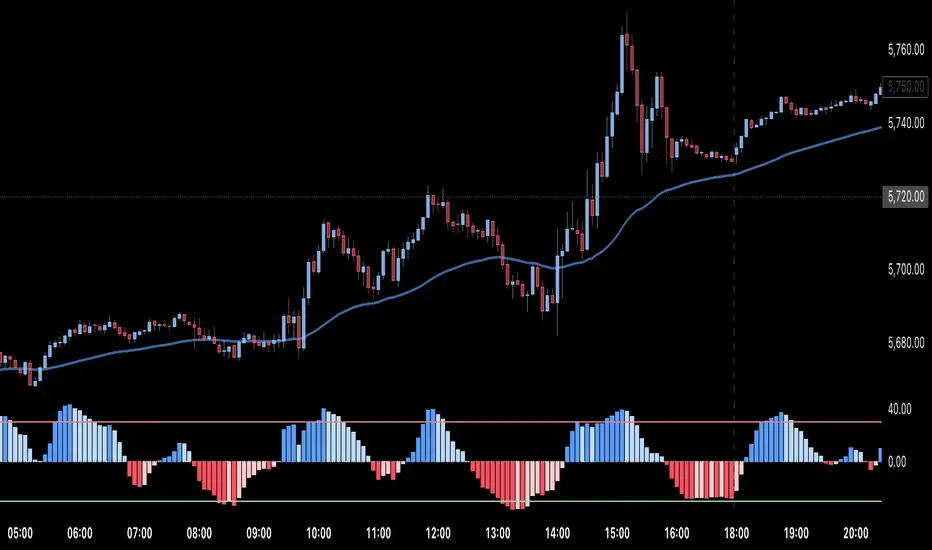
Stochastic-MACD Fusion Histogram (concept)
How It Works:
This indicator combines Stochastic Oscillator and MACD Histogram to create a unique momentum-tracking histogram. It blends stochastic-based overbought/oversold levels with MACD-based trend strength, helping traders identify potential reversals and trend momentum more effectively.
Stochastic Component: Measures where the price is relative to its recent range, highlighting overbought/oversold conditions.
MACD Component: Captures momentum shifts by calculating the difference between two EMAs and a signal line.
Fusion Algorithm: The MACD histogram is normalized and combined with the Stochastic %K using a weighted formula (60% Stoch, 40% MACD) to smooth fluctuations and improve signal clarity.
Usage:
Histogram Colors:
Blue / SkyBlue: Positive momentum increasing.
Red / LightRed: Negative momentum increasing.
Levels:
Overbought (>30): Potential selling pressure.
Oversold (<-30): Potential buying pressure.
Zero Line: Momentum shift zone.
Notes:
Best to combine it with others indicators for trend confirmation, like Moving Average, MACD, etc.
This indicator is good for quick entry/exit in futures market, from few seconds up to minutes.
It works well on 5 minutes candle. Regular Hours works better.
To sell wait for histogram to go OVER overbought level, once the first candle reach BELOW the overbought level hit sell. Same strategy for buy when it hits oversold level. Make sure you won't use the indicator alone.
受保护脚本
此脚本以闭源形式发布。 但是,您可以自由使用,没有任何限制 — 了解更多信息这里。
免责声明
这些信息和出版物并非旨在提供,也不构成TradingView提供或认可的任何形式的财务、投资、交易或其他类型的建议或推荐。请阅读使用条款了解更多信息。
免责声明
这些信息和出版物并非旨在提供,也不构成TradingView提供或认可的任何形式的财务、投资、交易或其他类型的建议或推荐。请阅读使用条款了解更多信息。