OPEN-SOURCE SCRIPT
已更新 Baseline (BL)

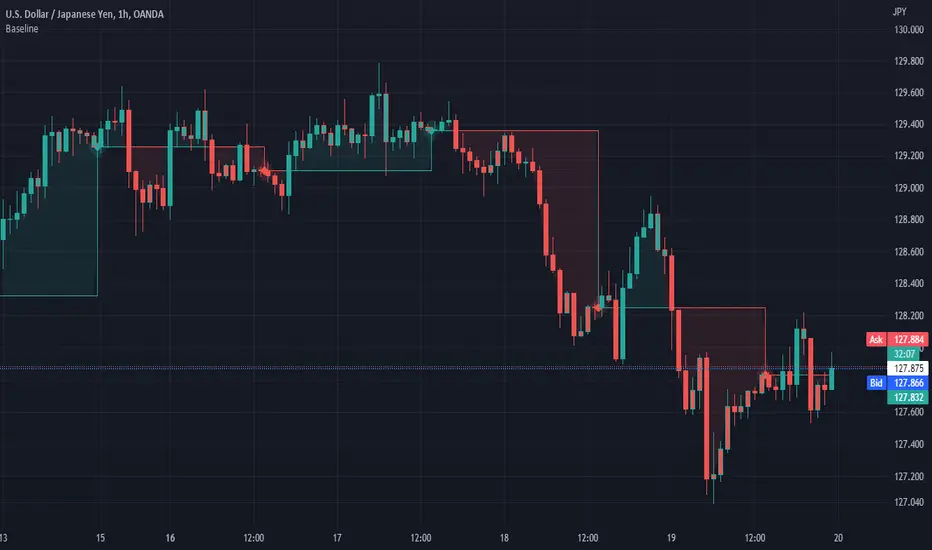
My baseline study lets you compare price to the previous days close. You can select the time frame for this baseline. I have included the ability to use a custom period length or your own anchor value. Custom anchor values are great for comparing the price to your cost average. The features I have included are bar color and background color.
I liked the idea of the 'baseline" chart but I didnt like the implementation.
Enjoy
I liked the idea of the 'baseline" chart but I didnt like the implementation.
Enjoy
版本注释
plot.style_stepline_diamond kind of sucks版本注释
turns out you dont need to specify timeframe's options. Enjoy the extra anchor periods. 开源脚本
秉承TradingView的精神,该脚本的作者将其开源,以便交易者可以查看和验证其功能。向作者致敬!您可以免费使用该脚本,但请记住,重新发布代码须遵守我们的网站规则。
免责声明
这些信息和出版物并非旨在提供,也不构成TradingView提供或认可的任何形式的财务、投资、交易或其他类型的建议或推荐。请阅读使用条款了解更多信息。
开源脚本
秉承TradingView的精神,该脚本的作者将其开源,以便交易者可以查看和验证其功能。向作者致敬!您可以免费使用该脚本,但请记住,重新发布代码须遵守我们的网站规则。
免责声明
这些信息和出版物并非旨在提供,也不构成TradingView提供或认可的任何形式的财务、投资、交易或其他类型的建议或推荐。请阅读使用条款了解更多信息。