INVITE-ONLY SCRIPT
已更新 Mean Reversion MA [acatwithwithcharts]
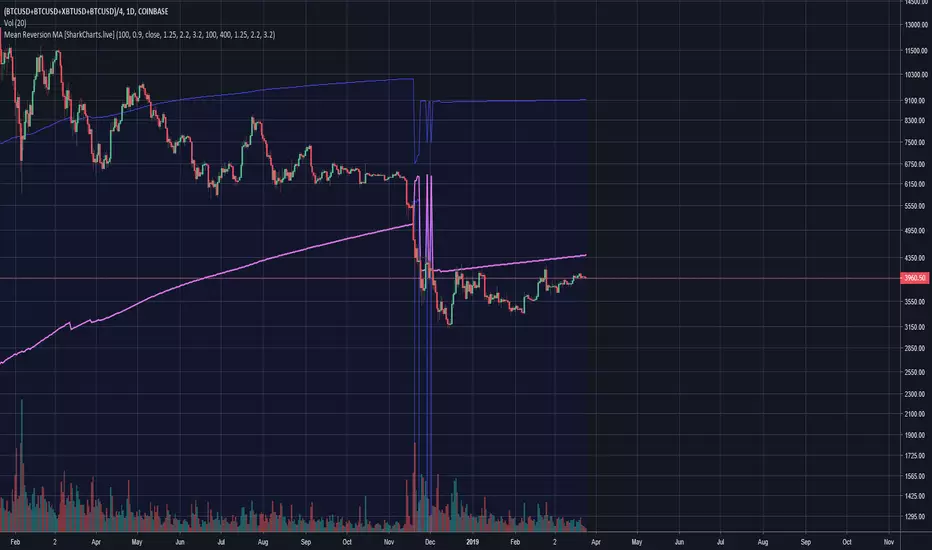
Mean Reversion MA is an experimental WIP indicator which tracks the furthest overexpanded period up to 2000 on a given timeframe as a target for eventual mean reversion. It currently allows for plotting BBands around that period and keeps track of the MA broken on the previous expansion and mean reversion.
In order to get this to work with useful precision, it has to be limited to SMA and regular STDEV. I have not found a way to reduce the Pinescript loop time enough otherwise while maintaining much precision. Even still, it will sometimes time out and need to be refreshed by either switching TF/symbol or reapplying the indicator.
On longer TFs this can result in targets that are extremely distant. No, it’s probably not a useful prediction on the SPX monthly chart that the selloff in 2009 suggests an eventual mean reversion to the 1250 SMA (currently around 358). The last time we had a monthly mean reversion on that chart by this indicator’s telling is 1970. So, use some common sense about how far out is a usefully-tradeable prediction. I’m hoping to find a good way to add functionality to put a cap on extreme long TF predictions without breaking it.
Where it really seems to shine is as a reactive pivot after apparent reversals. Significant trending more or less by definition requires overexpanded volatility on some period length.
I am posting this as invite-only and have a short list of collaborators in mind who will get access if they want it. It is not being made available to the general public as of this posting; I’m vaguely working towards eventually offering being able to offer some sort of paid indicator offering in the future.
Rather than shut the door entirely, I will say that if someone approaches me by PM with a really interesting idea on how they’d like to test this or my other indicators, I’m willing to consider giving access. I’m not giving this away just to anyone who asks and will, for my own time and sanity, probably just ignore requests by people who don't come to me already knowing what this indicator does and how they might want to use it.
版本注释
The display color now changes to orange when the period is maxed out as a warning that the maximum has been reached and that the true further overexpanded period is likely to be further out. 版本注释
Previous upload does not appear to be the version with the color change fix.版本注释
Bugfix: STDEV bands now correctly use the multiplier input.版本注释
This version adds the ability to reset tracking after a given number of bars and the ability to set a lower maximum period length as tools to help look at smaller overexpansions occurring before the largest one has completed mean reversion.版本注释
Updated to change the attribution in the title from [acatwithcharts] to [SharkCharts.live].I'm excited to announce that we're putting the finishing touches on a subscription service for the volatility theory indicators, and assuming no hiccups will launch them within days. Subscriptions will be available in several packages through SharkCharts.live
Current pricing and subscription details will be kept up-to-date on SharkCharts.live
版本注释
Minor visual change in how bands are handled where a period is not being tracked.版本注释
Improves handling of bands when tracking previous overexpansion.版本注释
For whatever reason, the previous update didn't seem to be showing when I loaded the script up after publishing.版本注释
Adds support for showing multiple sets of bands around target means.版本注释
I modified the color scheme of the previous tracked period to give better contrast with Compression MA and default BB Meow Mix bands on the same chart.仅限邀请脚本
只有作者授权的用户才能访问此脚本。您需要申请并获得使用许可。通常情况下,付款后即可获得许可。更多详情,请按照下方作者的说明操作,或直接联系acatwithcharts。
TradingView不建议您付费购买或使用任何脚本,除非您完全信任其作者并了解其工作原理。您也可以在我们的社区脚本找到免费的开源替代方案。
作者的说明
My volatility-based indicators are available for sale at SharkCharts.live
Feel free to reach out to me with any questions; more information is available on the SharkCharts website and the SharkCharts discord discord.gg/YVpTeSK
Feel free to reach out to me with any questions; more information is available on the SharkCharts website and the SharkCharts discord discord.gg/YVpTeSK
免责声明
这些信息和出版物并非旨在提供,也不构成TradingView提供或认可的任何形式的财务、投资、交易或其他类型的建议或推荐。请阅读使用条款了解更多信息。
仅限邀请脚本
只有作者授权的用户才能访问此脚本。您需要申请并获得使用许可。通常情况下,付款后即可获得许可。更多详情,请按照下方作者的说明操作,或直接联系acatwithcharts。
TradingView不建议您付费购买或使用任何脚本,除非您完全信任其作者并了解其工作原理。您也可以在我们的社区脚本找到免费的开源替代方案。
作者的说明
My volatility-based indicators are available for sale at SharkCharts.live
Feel free to reach out to me with any questions; more information is available on the SharkCharts website and the SharkCharts discord discord.gg/YVpTeSK
Feel free to reach out to me with any questions; more information is available on the SharkCharts website and the SharkCharts discord discord.gg/YVpTeSK
免责声明
这些信息和出版物并非旨在提供,也不构成TradingView提供或认可的任何形式的财务、投资、交易或其他类型的建议或推荐。请阅读使用条款了解更多信息。